“The true prophet is not he who predicts the future, but he who reads history and reveals the present.”
. . . Eric Hoffer, an American moral and social philosopher. He was the author of ten books and was awarded the Presidential Medal of Freedom in February 1983.
We could almost hear our history professor espousing Hoffer’s works recently when we were asked by a particularly smart media type if trust and character would really command a “premium” price earnings (P/E) ratio in today’s environment? Our response was “of course,” and as an example we offered up a quote from John Pierpont Morgan, who built the his family’s fortunes into a colossal financial empire. The referenced exchange took place when an aging J.P. Morgan testified before a House of Representatives committee investigating the financial interests of the “House of Morgan” as a tough lawyer named Samuel Untermyer queried him. The exchange went like this:
Untermyer: “Is not commercial credit based primarily upon money or property?”
Morgan: “No sir, the first thing is character.”
Untermyer: “Before money or property?”
Morgan: “Before money or property or anything else. Money cannot buy it because a man I do not trust could not get money from me on all the bonds in Christendom.”
While Morgan’s language is from an era gone by, the essential insight is as “crystal” today as it was decades ago. Or, as Chris Farrell notes, “Markets work off a foundation of trust – a sense of character – which largely explains the disturbing machination of the equity markets over the past few years.” This “disturbing machination” insight was pointed out to us by our friend Frederick “Shad” Rowe, captain of Dallas-based Greenbrier Partners, last Friday when he read me an excerpt from Blackstone’s Byron Wein, who noted that 60% of equity trading is now being done by the machines (algos). To that point, it is of interest the recent rotation has seen the defensive sectors outperform. Such sectors seem to have more “character” than some of the other sectors, but we digress.
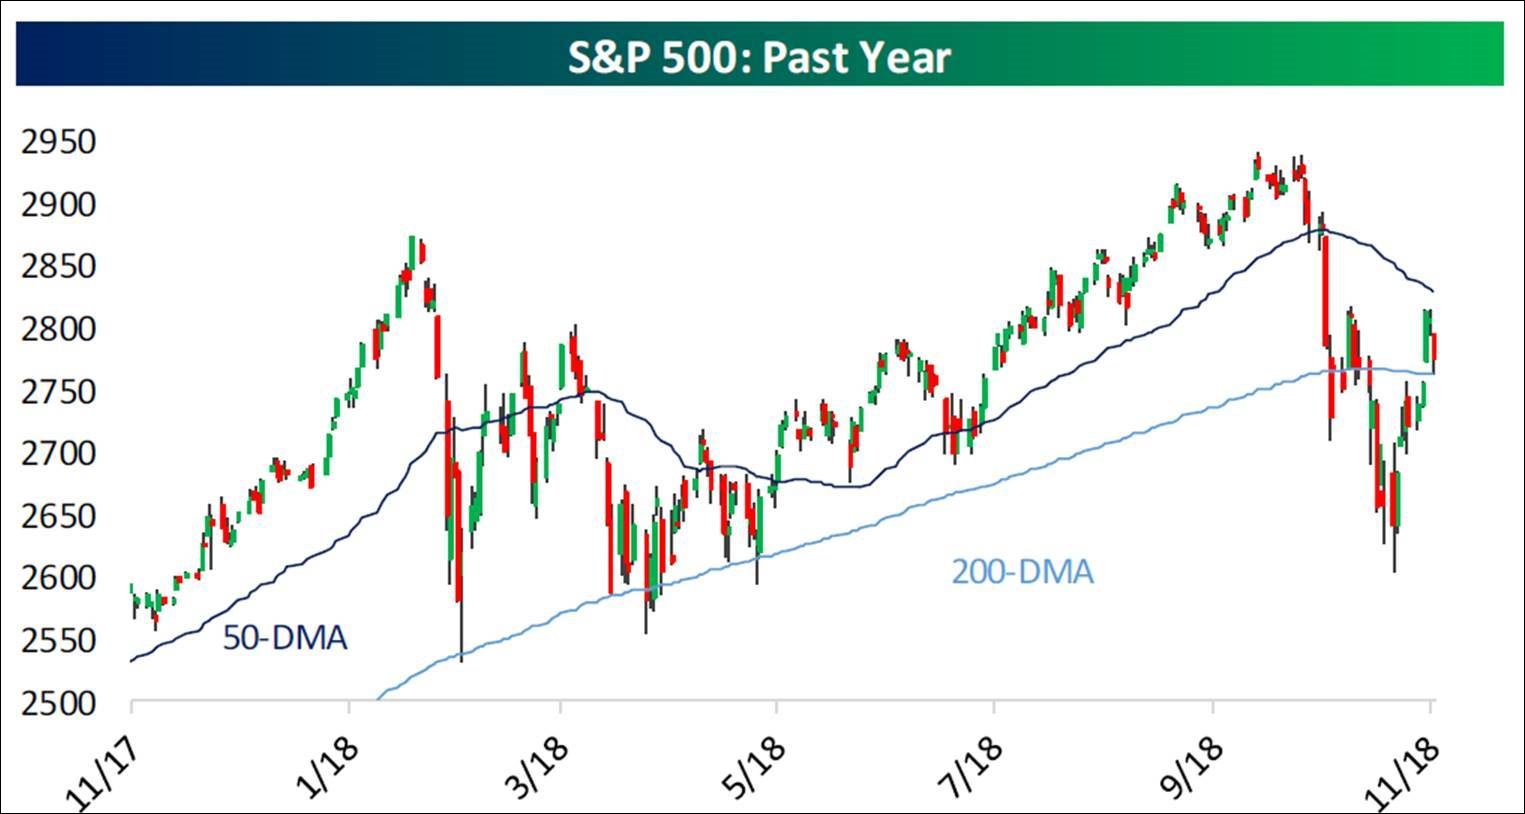
Fortunately, our models seem to be in-sync with the algos given the scenarios we have laid out since the trader’s “sell signal” of October 2 and the subsequent buy signal of October 29. Since that buy signal we have written the S&P 500 (SPX/2781.01) should rally into the 2800 – 2820 zone, which we deemed should prove pretty difficult to surmount, followed by a pullback. Initially, we thought the pullback could retest the 2600 -2650 level, but last week our intermediate proprietary model flipped positive, confirming our short-term proprietary model’s positive flip in late October, suggesting the downside should not be that severe barring any unexpected news. Accordingly, we wrote that if the upside chart gaps at 2756 and 2685 are closed (chart 1 on page 3), the pullback should be over and a dash to new all-time highs should be in the offing.
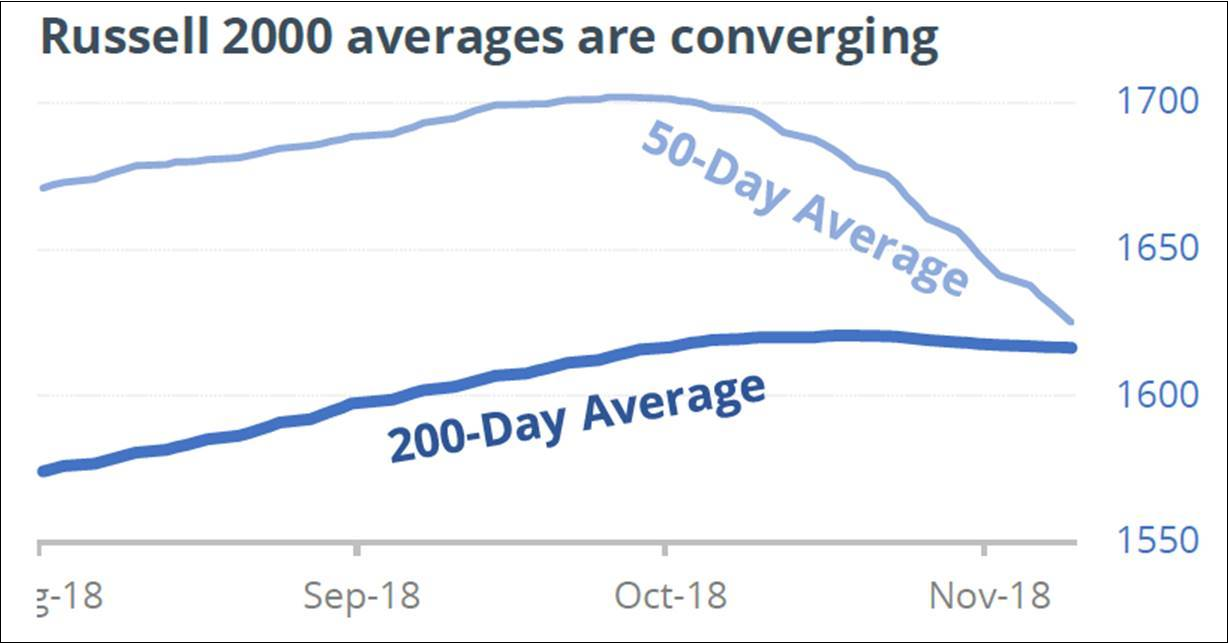
Currently, the SPX is in no man’s land trapped between its 50-day moving average (DMA) and its 200-DMA (chart 1). Not so the Russell 2000 (RUT/1549.49), which broke below its 50-DMA in late September and its 200-DMA in early October. Moreover, as our pal Jason Goepfert (SentimenTrader) writes:
In the fall of 2014, one of the most remarkable trends in the history of small-cap stocks came to an end. After more than two years of a steady uptrend, the 50-day average of the Russell 2000 finally crossed below the 200-day. That ended a streak of 660 days and ushered in a period of gyrations. Two years later, the Russell was about at the same place as it was when the trend ended. It’s about to repeat that setup. Another notable run in small-cap stocks is in trouble, as the Russell’s moving averages are on the verge of crossing for the first time in more than 600 sessions, the 2nd longest streak in its history (chart 2).
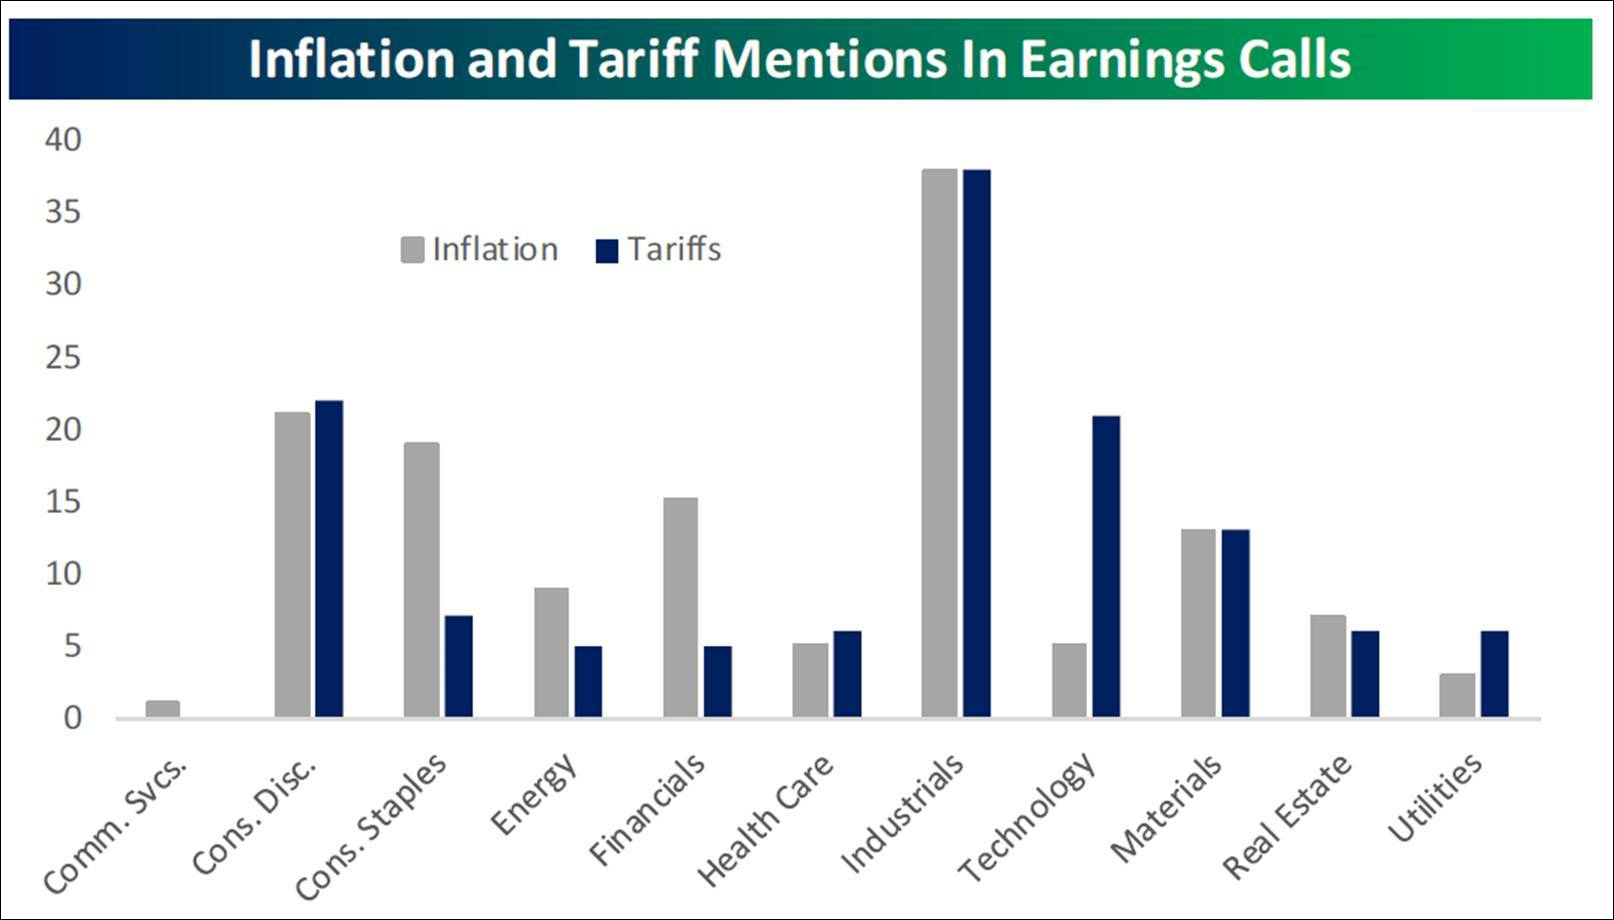
Turning to earnings, with nearly 90% of the S&P 500 companies reporting, and earnings season winding down, earnings have come in at around a +26% growth rate and revenues have improved at almost a 10% clip. This is not an unimportant point since for years the “bear boos” trumpeted the fact that revenues were flat and companies were manufacturing earnings by cutting costs (the Japanese call that Ziatech, or financial engineering). Of interest is that 27.7% of reporting companies in the S&P 500 have mentioned tariffs on their earning’s call. That does not mean all those companies are being impacted by said tariffs. It depends on the industry and the nature of the business. Also, inflation seems to be a concern with some 30% of companies discussing the inflationary impact on their businesses. Wage inflation has also been topic of discussion given the tight labor market (chart 3 on page 4).
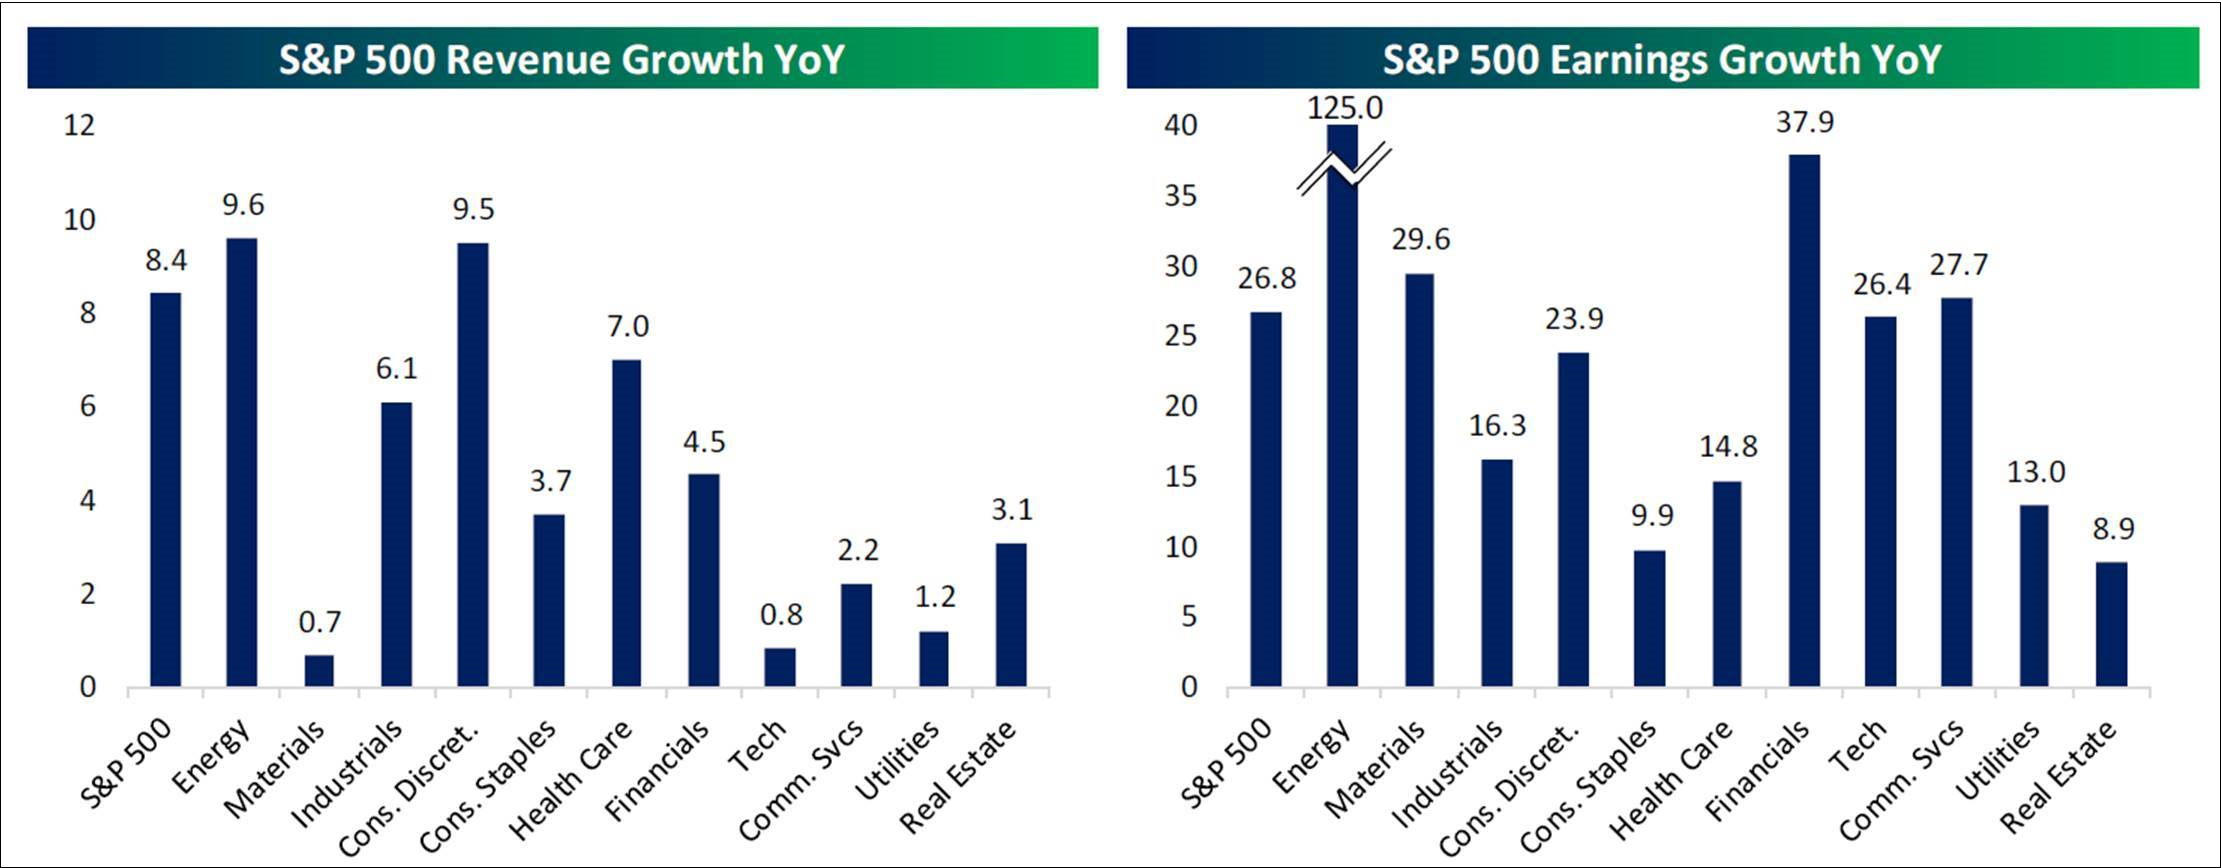
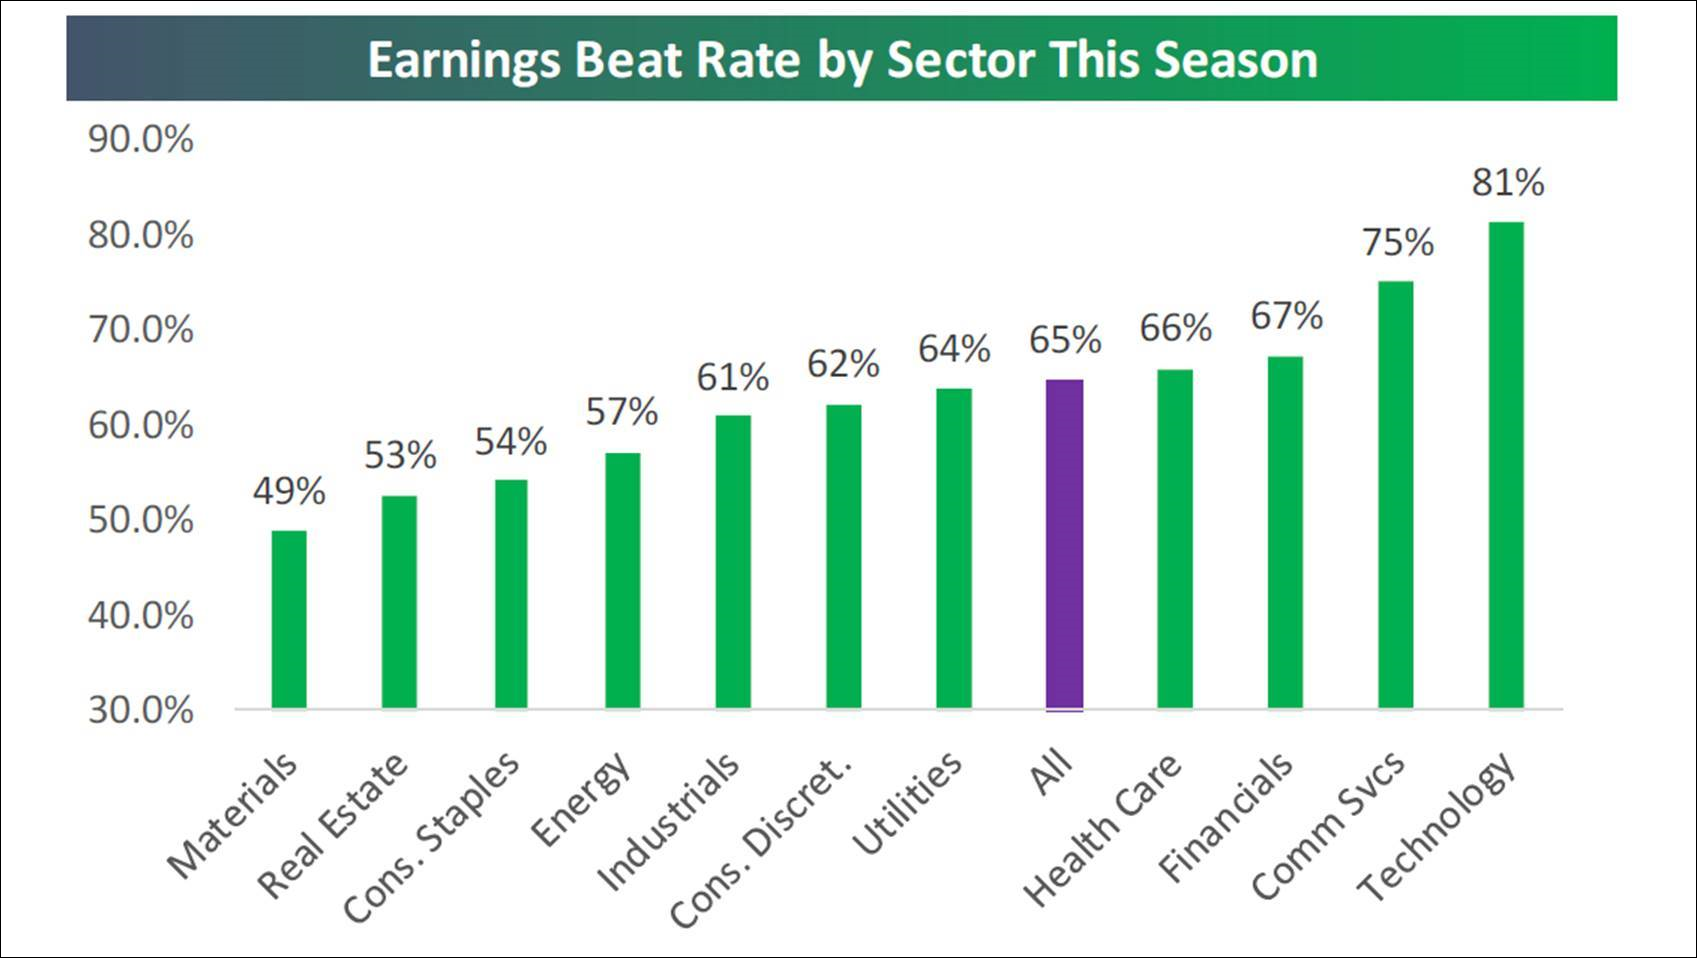
Speaking to the sectors, so far every macro sector has reported both revenue and earnings growth for 3Q18 with revenues up the most in the Energy and Consumer Discretionary sectors. Healthcare has also shown sizable gains. Profits are up the most in Energy (profits +26%) with even the defensive sectors of Real Estate and Consumer Staples showing high-single-digit gains. Financials have seen profits better by some 50% from a year ago. Earnings and revenue growth remain robust (chart 4). You can see the earning’s “beat rate” by sector in chart 5 (page 5). The best performing sectors last week were: Healthcare (+4.01%); Real Estate (+3.65%); Utilities (+3.10); Consumer Staples (+2.88%); and Financials (+2.61%). Read those as defensive sectors.
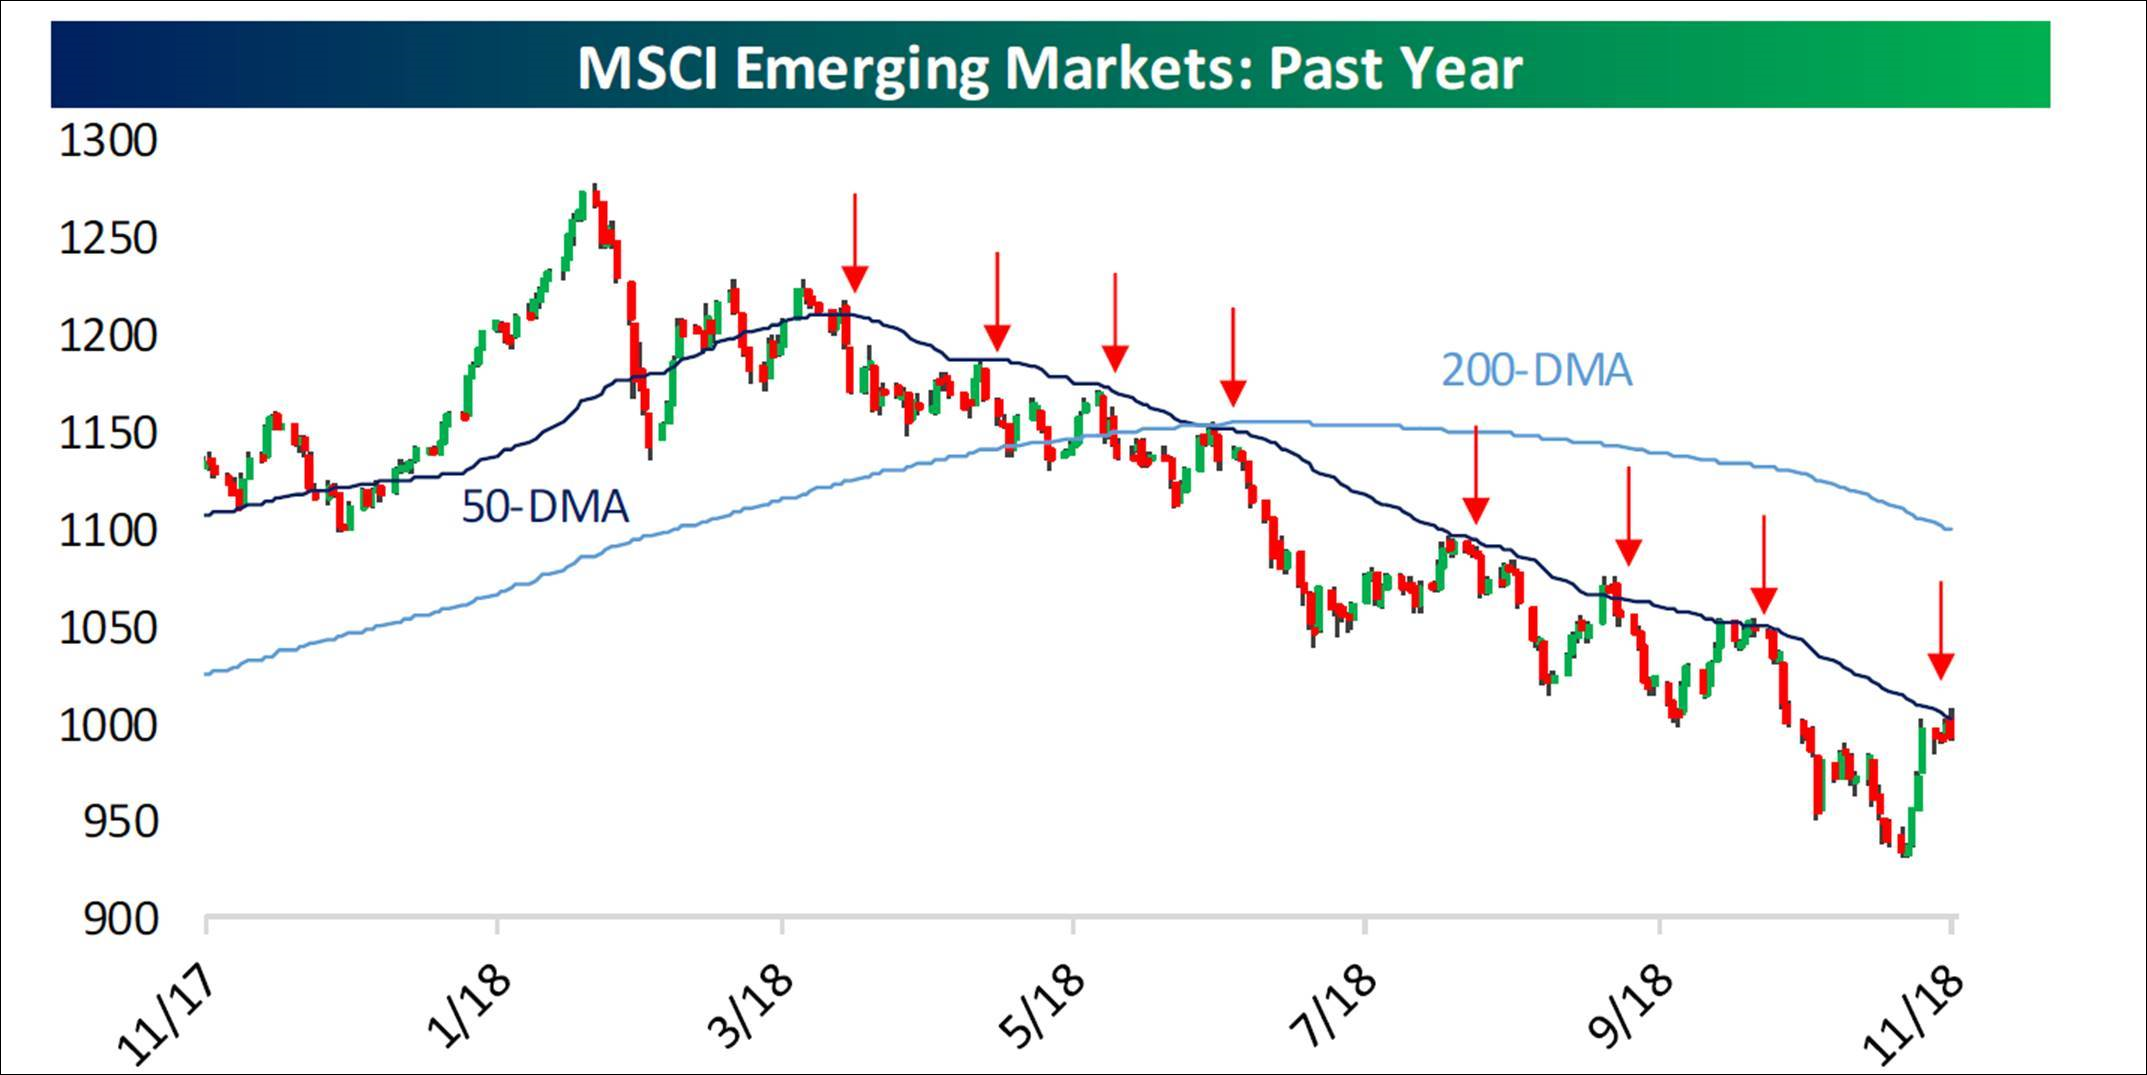
As for investment and/or trading ideas, we have repeatedly featured the midstream master limited partnerships (MLPs) over the past number of months. You can take your pick from our fundamental analysts’ favorably rated names. Around the 2600 bottom we offered the idea of buying into the D-J Transports using the vehicle of your choice. Last week we showed the bullishly configured charts of natural gas and Mexico. Today we feature emerging markets, which seem to be at an upside breakout point (chart 6).
The call for this week: When the SPX traded into our target zone of 2800 – 2820 last week we wrote:
“Don’t look now, but the huge rally we’ve seen in U.S. equities over the last few days has actually left the S&P 500’s 10-day advance/decline line at its most overbought level in the past year! So while the S&P’s price is still below its 50-day moving average, very near-term internals suggest that we’re actually due for some downside mean reversion again at this point.”
Keep in mind that the aforementioned quote is merely a “trading call” because as often stated in these reports, we think the lows were made on October 29, 2018, given the extreme readings registered in late October. As one Wall Street wag writes:
[In late October] the 14-week stochastic closed the week at an extreme that has marked important bottoms. Ten of the eleven such signals took place close to intermediate-term lows. . . . Historically, sharp ramps in the VIX to above 20 associated with a 10-week rate-of-change above 90 have also taken place within earshot of an intermediate-term low. . . . The Tick Index represents the number of NYSE securities trading on an uptick minus the ones trading on a downtick. This reading reached an extreme of +1400 and -1400 in late October. Such readings have coincided with significant lows over recent years.
This morning the preopening futures are flat on no real overnight news. On Friday the SPX bottomed at 2764.24. Its 200-DMA is at ~2763, which is obviously an important support level.
Additional information is available on request. This document may not be reprinted without permission.
Raymond James & Associates may make a market in stocks mentioned in this report and may have managed/co-managed a public/follow-on offering of these shares or otherwise provided investment banking services to companies mentioned in this report in the past three years.
RJ&A or its officers, employees, or affiliates may 1) currently own shares, options, rights or warrants and/or 2) execute transactions in the securities mentioned in this report that may or may not be consistent with this report’s conclusions.
The opinions offered by Mr. Saut should be considered a part of your overall decision-making process. For more information about this report – to discuss how this outlook may affect your personal situation and/or to learn how this insight may be incorporated into your investment strategy – please contact your Raymond James Financial Advisor.
All expressions of opinion reflect the judgment of the Equity Research Department of Raymond James & Associates at this time and are subject to change. Information has been obtained from sources considered reliable, but we do not guarantee that the material presented is accurate or that it provides a complete description of the securities, markets or developments mentioned. Other Raymond James departments may have information that is not available to the Equity Research Department about companies mentioned. We may, from time to time, have a position in the securities mentioned and may execute transactions that may not be consistent with this presentation’s conclusions. We may perform investment banking or other services for, or solicit investment banking business from, any company mentioned. Investments mentioned are subject to availability and market conditions. All yields represent past performance and may not be indicative of future results. Raymond James & Associates, Raymond James Financial Services and Raymond James Ltd. are wholly-owned subsidiaries of Raymond James Financial.
International securities involve additional risks such as currency fluctuations, differing financial accounting standards, and possible political and economic instability. These risks are greater in emerging markets.
Investors should consider the investment objectives, risks, and charges and expenses of mutual funds carefully before investing. The prospectus contains this and other information about mutual funds. The prospectus is available from your financial advisor and should be read carefully before investing.
Copyright © Raymond James