
World markets have remained volatile over the last week as we have moved into the heart of quarterly earnings season. North American stocks have been all over the place with a number of violent adjustments in reaction to earnings reports.
In the last few days, bargain hunters have attempted to mount a defense and the occasional stock has managed to rally, but each rebound attempt by a US index has found itself beaten back down, indicating that bears continue to have the upper hand. On Wednesday, the Dow and the S&P 500 plunged into negative territory on the year and the NASDAQ registered an official correction, closing down more than 10% off its 52-week high.
While October has historically been one of the most volatile months of the year for stock markets, it’s has also been a month that often features the establishment of significant bottoms. This year, however, is looking more like 2016 where the combination of political uncertainty over the US midterm elections and market uncertainty over world economy and earnings outlook, could drag on well into November.
In this issue of Equity Leaders Weekly, we reflect on a significant recent change in the SIA Asset Class Rankings that saw International Equities move downward and Commodities move upward by taking a closer look at European stocks and Sugar.
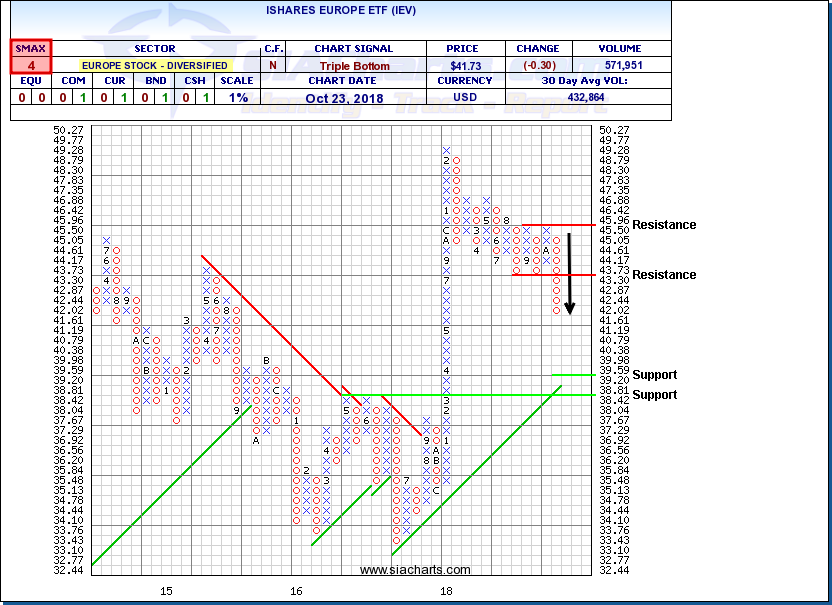
iShares Europe ETF (IEV)
Back in the summer, rallies to new all-time highs by US indices drew attention away from deteriorating conditions in international markets. Asia Pacific indices and emerging markets like China initially led the way downward and continue to trade at or near their 52-week lows. In the last week, Europe has taken a big step downward as well with the Dax plunging to a new 52-week low.
The big showdown between the EU and Italy over its budget deficit has really rattled investors. Brussels was able to steamroll over small, peripheral countries like Greece or Portugal in the past, but Italy is a much bigger player with the ability to push back. Ongoing uncertainty over deadlocked Brexit talks with the March exit date looming isn’t helping matters either.
The iShares Europe ETF (IEV) had been steadily retreating since peaking in early February, but declines have accelerated this month. The recent break below $43.80 completed a bearish Triple Bottom pattern signalling the start of a new downtrend that could potentially test the $40.00 round number, or support near $39.20 based on a horizontal count, or $38.40. Initial resistance appears near $43.75 and the breakdown point. A bearish SMAX of 4 indicates IEV is exhibiting near-term weakness relative to the asset classes.
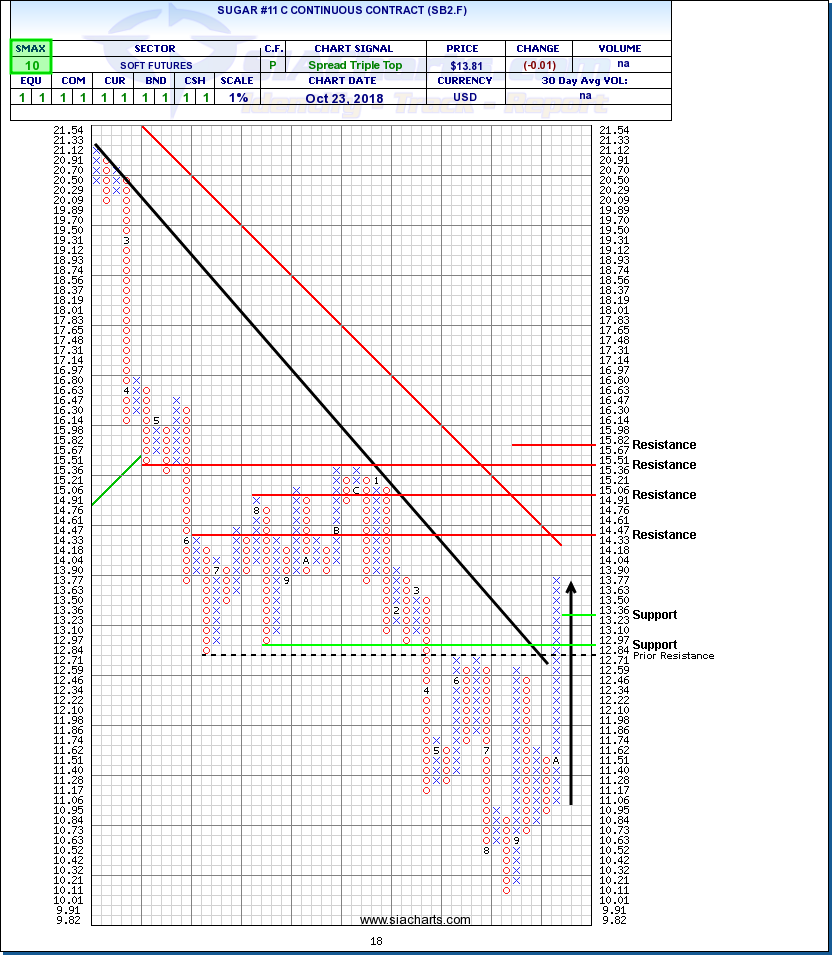
Sugar #11 Continuous Contract (SB2.F)
With capital flowing out of risk markets like stocks, investors have been asking us where people are going to hide? One historical parking place for capital, US bonds, has become closed off with rising interest rates pushing bond prices downward.
One group that has been attracting some interest is commodities, but not necessarily the ones you would think of. Headline contracts in the Energy sector have been getting crushed in the last week, particularly WTI, Brent and Gasoline. Precious metals, on the other hand, have been picking up but not just the traditional stores of value like gold and silver; Platinum and Palladium have joined the recovery party. New interest has also emerged in some of the agricultural and soft commodity markets like Corn and Coffee.
Sugar has been doing particularly well lately. With a perfect bullish SMAX score of 10, #11 Sugar is exhibiting strength across the asset classes. It recently broke out of a base, clearing $12.84 which completed a bullish Spread Triple Top pattern. Sugar has continued to climb, advancing on $13.80 with next potential upside resistance tests possible near $14.47, $15.00, $15.50 and $15.80. Initial support appears near $13.25.
SIACharts.com specifically represents that it does not give investment advice or advocate the purchase or sale of any security or investment. None of the information contained in this website or document constitutes an offer to sell or the solicitation of an offer to buy any security or other investment or an offer to provide investment services of any kind. Neither SIACharts.com (FundCharts Inc.) nor its third party content providers shall be liable for any errors, inaccuracies or delays in content, or for any actions taken in reliance thereon.