by Liz Ann Sonders, Senior Vice President, Chief Investment Strategist, Charles Schwab & Co
Key Points
- Real GDP surged in the second quarter; with big boosts coming from consumption and exports.
- Productivity’s improvement is underappreciated.
- Earnings growth is surging and the stock market is not as narrow as many believe; but the expectations bar is high, and ongoing trade disputes are a growing risk.
Is the boost the economy and corporate earnings have received from tax cuts a sugar high, sustainable or something in between? At this point, I’ll vote for something in between. Let’s start with the overall economy and Friday’s gross domestic product (GDP) report. Although GDP is a purely backward look at the economy, it received more than the typical attention in light of the hoped-for surge, as well as the annual benchmark revisions accompanying the report.
Surging growth
Real (inflation-adjusted) GDP jumped to a 4.1% annual rate in the second quarter; below the consensus estimate of 4.4%, but the highest pace of growth in nearly four years. First quarter growth was revised up to 2.2% from 2.0% as part of the comprehensive revisions of GDP data back to 1929.
The table below looks at the component parts and weights of GDP and compares the second quarter to the prior three quarters. Personal consumption expenditures (PCE)—accounting for nearly 70% of the U.S. economy—rose 4.0%; with services up 3.1%, durable goods up 9.3% and nondurable goods up 4.2%. However, PCE was revised lower as a share of GDP for each year since 2007.
Exports surged 9.3% courtesy of energy-related product exports; but importantly also the acceleration in soybean exports in advance of the retaliatory tariffs put in effect by China. Given that import growth was much weaker at only 0.5%, net exports were on fire. The pace of growth will almost assuredly slow in future quarters.
Nonresidential fixed investment (business capital spending) was up 7.3%, reflecting the initial benefit from the tax cuts, but also the strength in the energy and technology sectors. Revisions were strong as well; with fixed investment revised higher for each of the past 10 years. On the other hand, residential investment subtracted from growth and has been down in four of the past five quarters.
Finally, inventories dropped by about $58 billion to about -$28 billion, which was the lowest level of inventories since the final quarter of 2009—subtracting 1.0 percentage point from second quarter real output growth.
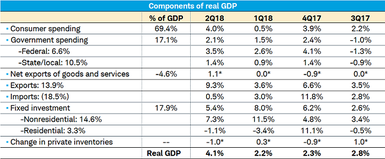
Source: Charles Schwab, Bureau of Economic Analysis, as of June 30, 2018. *Represents contribution to percent change in real GDP. Numbers may not add up to 100% due to rounding. Real GDP based on annualized Q/Q % change.
As noted, the report on Friday included comprehensive benchmark revisions to the National Income and Product Accounts (NIPA) data—while output growth was not revised significantly higher, gross domestic income (GDI) was revised up in each of the past five years by an average of 1.2%. As a result, the personal savings rate was revised significantly higher to 6.8% through the first quarter—more than double the prior reading of 3.3%. It’s now fair to say that worker pay’s share of corporate income (which is a measure of wage growth) is rising at a faster pace than previously-estimated.
Productivity’s acceleration
Based on Friday’s GDP report and prior revisions, productivity in the second quarter likely accelerated to 1.5% year-over-year, according to EvercoreISI. This continued acceleration is probably not getting the attention it deserves, and can clearly be seen in the table below. If productivity is +1.5% and wages are 3.0%, then unit labor costs (ULCs) would be up 1.5%. With the GDP price deflator up 2.4% and ULCs up 1.5%, profit margins would widen; which is a good segue to earnings.

Source: Charles Schwab, EvercoreISI, as of July 27, 2018.
Moving on to earnings
As seen in the charts below, second quarter earnings season so far is keeping up the gangbusters trend from the first quarter—in large part thanks to corporate tax cuts. Courtesy of the continued surge in Energy sector earnings—but also significant strength from Materials, Financials and Technology—earnings are expected to be up nearly 23% in the second quarter, following nearly 27% in the first quarter.
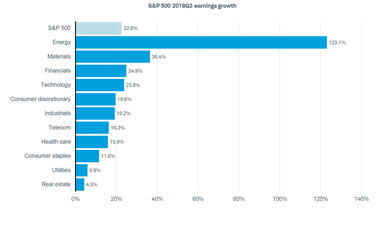
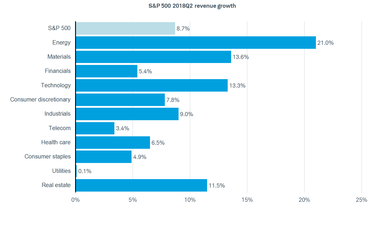
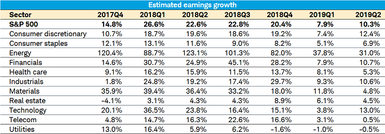
Source: Charles Schwab, Thomson Reuters I/B/E/S, as of July 27, 2018.
The “beat rate” (percentage of S&P 500 companies beating consensus estimates) is currently running at 83%, which if it persists would be a record. But with the theme of “’be careful what you wish for,” high beat rates historically have not been met with strong equity market performance. This reflects the market’s discounting tendencies and the possibility that stocks anticipate that bars which get set too high set up for future disappointment.
Facebook’s face plant
Capturing much of the earnings attention last week was Facebook’s miss and 19% drop on Thursday (just prior to the earnings release, FB traded at an all-time high). That plunge equated to $120 billion in stock market value lost, which is now the largest drop in history (prior record-holder was Intel from September 22, 2000).
But Facebook wasn’t the only loser on the day it reported earnings. Other notable and large-cap stocks fell hard; with four of the ten largest losers housed in the S&P 500. According to Bespoke Investment Group (B.I.G), it’s common to see a bunch of no name stocks on the list of worst performing stocks on earnings; but having four of the ten largest coming from the S&P 500 is rare.
More surprising though may be that with so many S&P 500 stocks taking big hits in reaction to earnings, the index overall closed higher last week. This is testament to the misperception many investors and pundits have about the “narrowness” of the market.
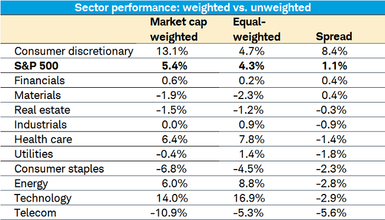
The BIG table below compares the year-to-date performance of the traditional market cap-weighted S&P 500 sectors to their performance on an equal-weighted basis. If only a small subset of stocks (various “FANG” groupings) were driving the market’s return this year, you would expect to see big divergences between these measurements of sector performance; with equal-weighted indices underperforming by a wide margin.
Source: Charles Schwab, Bespoke Investment Group (B.I.G.), as of July 27, 2018.
In reality though, only three sectors have better returns on a cap-weighted basis; and the only sector with significantly better cap-weighted performance is Consumer Discretionary—courtesy of Amazon, Netflix and a handful of other stocks. Even in the Technology sector, the equal-weighted year-to-date return has outperformed the cap-weighted return.
Most notable risk to growth
The net is that the “breadth” within the stock market and the economy suggest sustainable strength—but not likely at the current pace. Both the economy’s and earnings’ growth rates may be at or near peaks; although positive growth is likely to persist. The most notable risk to economic and earnings growth looking forward is the ongoing trade skirmish (war?). In fact, the topic has increasingly become prominent in quarterly corporate earnings conference calls.
According to BIG, during first quarter earnings season, mentions of the word “tariff” were fairly uncommon, with less than 20% of companies using the word in their calls. In the second quarter to-date, that’s doubled to about 40% of companies have mentioned tariffs. For all 500 companies during first quarter earnings season, the word was mentioned 209 times. In the second quarter to-date, even though only half the S&P 500 has reported, the term has already been mentioned 609 times.
The net is that trade uncertainty remains high and continues to have implications for both the economy overall, and corporate earnings.
Copyright © Charles Schwab & Co


