
Often interrupted by national holidays in the US and Canada, the first week of July is often a quiet time for stock markets. This week has been no exception so far with stocks holding steady. There has been more action in commodity markets where WTI crude oil has encountered resistance near $75.00/bbl and copper has broken down below $2.90/lb.
Economic news flow picks up later this week with ADP payrolls, Service PMI reports and energy inventory numbers due Thursday, followed by US nonfarm payrolls and Canada employment numbers of Friday. These numbers could influence economic and interest rate expectations heading into the summer which could impact trading in stocks, bonds, commodities and the US Dollar.
So far confession season has been quiet as investors position ahead of the upcoming earnings season. Historically, on a seasonal basis, July often sees a brief market bounce between the two weakest periods of the year for stocks; May-June and August-October. June was a choppy month for stocks and so far it looks like earnings season could give stocks a bit of a reprieve. With US midterm elections coming in November, however, political uncertainty, particularly surrounding the threat of a trade war, could ramp up and overshadow markets from late summer well into the autumn.
In this week’s issue of Equity Leaders Weekly, we conduct our monthly review of capital flows between sectors through the SIA Charts Sector Scopes report. We also look at the potential implications for bonds and stocks of the US 30-Year Treasury yield dropping back under 3.00%.
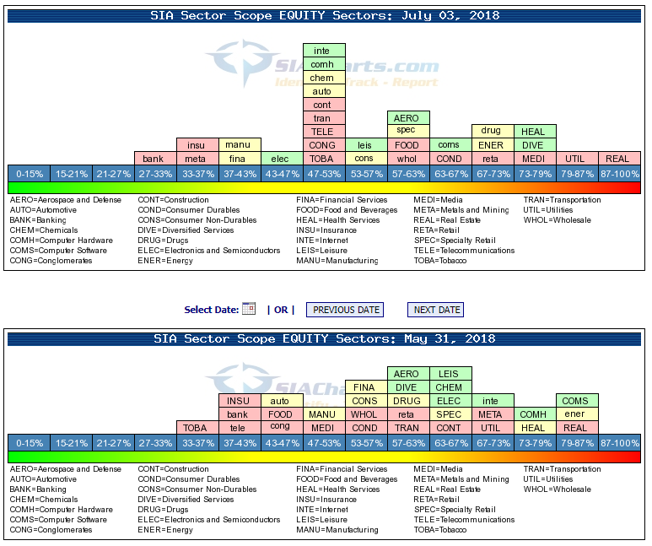
July Sector Scopes Review
The Sector Scopes section tracks the Bullish Percent (percentage of stocks on a group on bullish Point and Figure signals) for 31 stock market industry sectors. In addition to providing a snapshot of which sectors may be overbought, oversold or neutral, tracking changes over time indicate areas where capital is moving in and where capital is leaving.
A month ago, the Sector Scopes had shown groups collecting toward the right-hand side of the chart, indicating bullishness. Over the course of a choppy June, a number of sectors have dropped back into the middle, a more neutral position. This could be seen as showing balance between bulls and bears, but also perhaps indecision among investors about which way markets could move next.
Interest sensitive sectors were particularly mixed. While banks and insurance companies fell to the left side, utilities and real estate saw their bullish percent climb as they moved to the far-right side of the chart. Energy saw its bullish percent increase as rising oil prices fuelled a rebound in energy stocks and weighed on the Transportation sector. Metals, on the other hand, tumbled dramatically as the growing threat of a trade war between the US and China sparked a selloff in Copper. Defensive groups like Food, Tobacco, Drugs also moved rightward, an indication of growing uncertainty among investors.
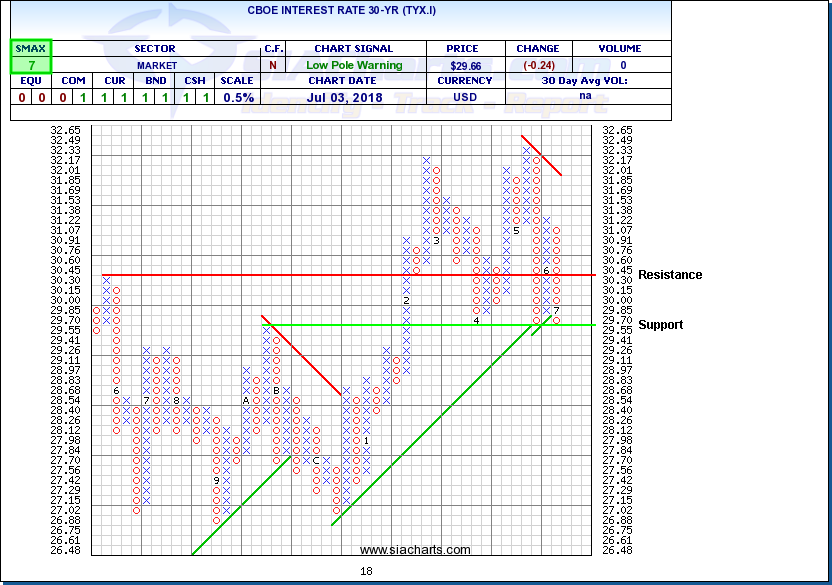
CBOE Interest Rate 30-Year (TYX.I)
At the end of January, the CBOE 30-year interest rate broke through the 3.00% barrier, which signaled the end of the easy money party and sparked a big selloff in global stock markets. Although the Fed has raised interest rates twice since than and signaled its intention to raise interest rates another 4-6 times over the next 12-18 months, the 30-year rate has been falling since May. This suggests that investors are not expecting interest rates to stay above 3.00% for the long term.
The drop of the 30-year rate back under 3.00% has mixed implications for world markets. For the short term, falling long-term rates has shored up support for stock markets. In recent weeks, the NASDAQ Composite, Russell 2000, S&P/TSX Composite and S&P SmallCap 600 have all reached new all-time highs. This move may also shore up bond prices and has had a positive impact on some interest sensitive sectors of the stock market including Real Estate and Utilities.
For the longer-term, however, the implications could be more bearish. Interest rates usually rise along with expectations of economic growth and inflation. The fall in the 30-year yield indicates that the longer-term outlook for the US economy isn’t as rosy as it was a few months ago. Whether this is due to trade war concerns or other factors, the longer-term outlook for US corporate earnings may be weakening, which could be impacting US financials. Recall that US banks peaked in early 2007, about six months ahead of the stock markets and 18 months before everything really hit the fan in the fall of 2008.
A key support test is currently underway for the 30-year interest rate at 2.95%. Uptrends have been showing signs of cracking but a break under 2.95% would complete a top, signal the start of a new downtrend and could be like a dam bursting. On the other hand, a successful test of support would keep the underlying upward trend in rates intact.
SIACharts.com specifically represents that it does not give investment advice or advocate the purchase or sale of any security or investment. None of the information contained in this website or document constitutes an offer to sell or the solicitation of an offer to buy any security or other investment or an offer to provide investment services of any kind. Neither SIACharts.com (FundCharts Inc.) nor its third party content providers shall be liable for any errors, inaccuracies or delays in content, or for any actions taken in reliance thereon.