by John Lynch, Chief Investment Strategist, LPL Financial
KEY TAKEAWAYS
- After the longest run of outperformance of growth stocks ever, we think value may be poised for a comeback.
- Value stocks may be supported by accelerating economic growth, attractive relative valuations, and the potential for improved financials sector performance.
- We expect modest value outperformance over the balance of the year.
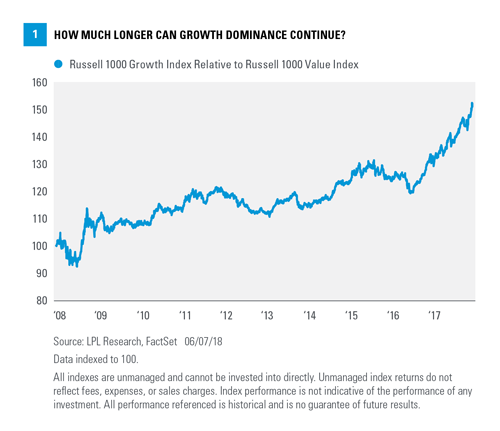
When will value have its day in the sun? The growth style’s historic run of outperformance has continued this year, despite the emergence of several drivers that have traditionally served as catalysts for value stock outperformance. Generally, value stocks benefit from an economic growth tailwind, whereas growth stocks tend to be more in favor when the growth potential they offer is scarce. Year to date, the Russell 1000 Growth Index has returned 9.5%, compared with just 0.5% for the Russell 1000 Value Index. Over the past 10 years, including the 2008–09 financial crisis, large cap growth stocks have outperformed value stocks by about 80 percentage points [Figure 1]. Based on the longest available data series*, the current growth stock rally is actually the longest ever. So as summer approaches, we ask: When will value finally have its day in the sun and start to shine?
WHAT’S WRONG WITH VALUE?
Accelerating economic growth has historically helped the value style, a condition that is in place today. Consensus forecasts for U.S. gross domestic product (GDP) reflect a solid rebound from 2.2% growth in the first quarter to over 3% in the second and third quarters. We forecast GDP growth for this year at near 3%, above last year’s 2.2% and consistent with consensus. Yet, the growth style of investing has continued to lead the equity market higher.
Accelerating earnings have also historically provided a tailwind for value that has not worked recently. Earnings growth accelerated over the past two quarters even when the benefit of the tax cut is excluded from the profit calculation. Though second-quarter earnings growth may slow from the previous quarter’s pace, we do not expect much deceleration. Consensus estimates reflect strong double-digit increases for the next three quarters, at or near 20%.
Accelerating economic and profit growth does not always lead to value outperformance. The late 1990s were a glaring exception when growth stocks significantly outperformed on technology’s strength.
So what’s wrong with value? A few things:
- Interest rate sensitivity. Higher interest rates have been a drag on the high dividend paying areas within the value style, including real estate, telecom, and utilities. Consumer staples, which have had a very difficult year, also tilt toward value. We are not big fans of these defensive income-oriented sectors. However, in a more volatile market environment, we would have expected a smaller performance gap relative to growth stocks.
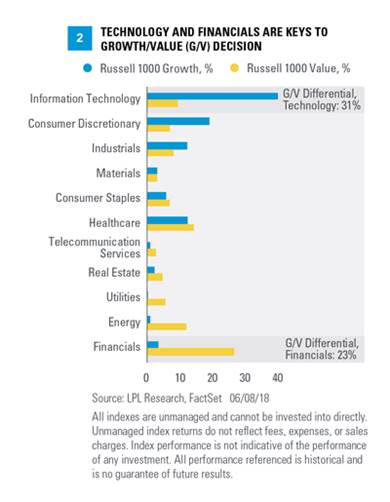
- Flattening yield curve. Those higher interest rates would typically be expected to help the financials sector (the largest sector of value [Figure 2]), since it leads to higher returns on financial institutions’ assets and more profitable loans. Although higher short-term interest rates have helped some financial companies, long-term interest rates (think 10-year Treasury) have not moved higher by nearly as much, flattening the yield curve. The shrinking gap between short-term rates (cost of funds) and longer-term rates (return on funds via loans) has been a drag on the financials sector, which has underperformed the overall market this year. Year to date, the S&P 500 Financials Index has returned just 1%, behind the 4.8% return for the S&P 500 Index. We continue to favor the sector based on our expectation that the yield curve will steepen, as longer-term interest rates rise, deregulation efforts persist, and profitability improves.
- Technology strength. The technology sector, which is the biggest growth sector by far, has had a tremendous year. Year to date, the S&P 500 Information Technology Index has returned over 14%, well ahead of the S&P 500. Market-beating gains in technology this year, and in recent years, have been supported by underlying earnings strength. However, relative valuations for the sector are near post-financial-crisis highs, at a 14% premium to the S&P 500 on a forward price-to-earnings (PE) basis, while regulatory risk has risen in recent months. We still like the technology sector for the strong earnings trends and potential increases in capital spending, but the pace of outperformance may moderate after such a strong run.
- Surprising strength in consumer cyclical stocks. Strong gains for internet retailers have carried the consumer discretionary sector to double-digit returns year to date and also helped drive continued growth outperformance. Consumer discretionary stocks include many retailers, which tend to perform better during the early and middle stages in the economic cycle. Now nine years into the current economic expansion (with few signs that it may end anytime soon), we would expect the sectors leveraged more toward businesses to perform better, including areas that tend to do better when inflation rises (think industrials, materials, energy). Internet retailers may continue to outperform, but the magnitude may moderate and limit gains for the broad sector.
GROWTH LOOKS EXPENSIVE
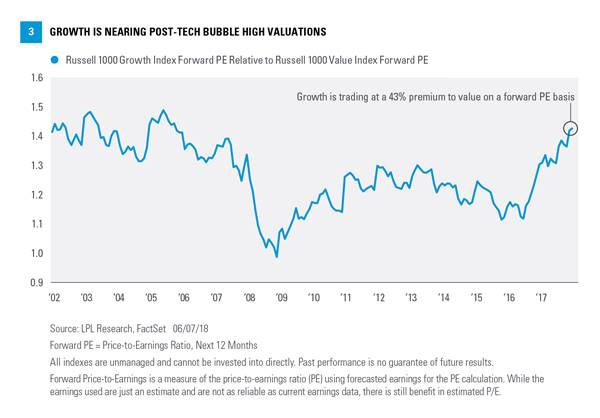
After several years of strong relative performance for growth, it is not surprising that growth stocks’ relative valuations look stretched. Growth almost always trades at higher valuations than value, but the current premium, at 43% on a forward PE ratio basis, appears rich [Figure 3]. That premium is the highest in about 12 years and is well above the post-technology bubble (since 2000) average of 28%. Although valuations are not good timing tools, they may limit the potential for growth outperformance.
COUNTERBALANCES AND CONCLUSION
Certainly some of the dynamics noted above could continue. Timing reversals is very difficult. Technology could continue to lead. Higher interest rates could weigh on the defensive value sectors but not steepen the yield curve, hurting financials. The internet retail group could continue to power the growth-heavy consumer discretionary sector higher.
Another risk worth pointing out regarding value vs. growth is potentially weaker oil prices. Not only would that hurt the value-heavy energy sector, it would potentially provide fuel for the growth-focused consumer discretionary sector. The production limits from OPEC and Russia could potentially be lifted this summer, adding to global supply. The seasonal boost to oil prices from the start of the summer driving season may already be behind us. U.S. production is humming along. We do not see much upside to oil prices in the near term, and our energy sector view is neutral.
Additionally, we continue to like the industrials sector, which slightly leans growth based on the Russell methodology. Increases in business investment may support the sector, as well as technology, and support the growth style.
After the longest run of outperformance of growth stocks ever, we think value may be poised for a comeback. Although it is difficult to predict the timing of a turnaround, we would not be surprised if value stocks get some days in the sun this summer, supported by accelerating economic growth, attractive relative valuations, and potentially better financials sector performance.
IMPORTANT DISCLOSURES
* Based on French-Fama data.
The French-Fama value factor sorts all U.S. incorporated NYSE, AMEX, and NASDAQ listed stocks in the comprehensive Center for Research in Security Prices (CRSP) database, divides them into two groups by size, and sorts each size grouping by book value to price. Book value is an accounting estimate of the amount that would be left to shareholders if all assets were liquidated and all debts repaid. Stocks with a high book value to price are considered cheaply valued and are often referred to as value stocks; those with low book value to price are considered expensively valued and are often referred to as growth stock. The performance of the value factor is the difference between the average return of the 30% highest book to value stocks and the 30% lowest book to value stocks. The return of the growth factor is simply the inverse of the value factor. The overall performance of value versus growth over time can be represented by turning the return to the factor into an index. For more information and updated historical data see http://mba.tuck.dartmouth.edu/pages/faculty/ken.french/data_library.html, or for a complete description of the methodology, see Eugene F. Fama and Kenneth R. French, “Common Risk Factors in the Return on Stocks and Bonds,” Journal of Financial Economics 33 (1993) 3–56.
The opinions voiced in this material are for general information only and are not intended to provide specific advice or recommendations for any individual. To determine which investment(s) may be appropriate for you, consult your financial advisor prior to investing. All performance referenced is historical and is no guarantee of future results.
The economic forecasts set forth in the presentation may not develop as predicted and there can be no guarantee that strategies promoted will be successful.
Investing in stock includes numerous specific risks including: the fluctuation of dividend, loss of principal, and potential liquidity of the investment in a falling market.
Because of their narrow focus, specialty sector investing, such as healthcare, financials, or energy, will be subject to greater volatility than investing more broadly across many sectors and companies.
Technical Analysis is a methodology for evaluating securities based on statistics generated by market activity, such as past prices, volume and momentum, and is not intended to be used as the sole mechanism for trading decisions. Technical analysts do not attempt to measure a security’s intrinsic value, but instead use charts and other tools to identify patterns and trends. Technical analysis carries inherent risk, chief amongst which is that past performance is not indicative of future results. Technical Analysis should be used in conjunction with Fundamental Analysis within the decision-making process and shall include but not be limited to the following considerations: investment thesis, suitability, expected time horizon, and operational factors, such as trading costs.
Value investments can perform differently from the market as a whole. They can remain undervalued by the market for long periods of time.
As noted in Outlook 2018: Return of the Business Cycle, LPL Research projects real gross domestic product (GDP) growth of around 3.0% in 2018. This is in line with historical mid-cycle growth of the last 50 years. Economic growth is affected by changes to inputs such as business and consumer spending, housing, net exports, capital investments, and government spending.
All investing involves risk including loss of principal.
Copyright © LPL Financial