
by Jurrien Timmer, Director of Global Macro, @TimmerFidelity, Fidelity Investments Canada
MARCH 2018
A feature article from our U.S. partners Storm Clouds and Silver Linings The recent correction rattled the market, but it may be just what stocks needed to resume their uptrend.
Key Takeaways
• The U.S. stock market plummeted roughly 12% during a recent two-week stretch, based partially on two imbalances that have been developing since August 2017.
• One imbalance was the stock market’s lack of attention to the sharp rise in bond yields; the other was an unwarranted expansion in stock valuations following the recent tax cuts.
• The good news is that while it was painful in the short term, the recent market correction appears to have mostly remedied these two imbalances.
• Another plus is that the bond market is now better reflecting the Fed’s likely policy track than it did six months ago when yields were much lower.
After a long and record run of strong gains and low volatility, the recent two-week stock market correction was swift and violent. From its intraday high on January 26 through its close on February 9, the Standard & Poor’s 500 Index (S&P 500®) declined nearly 12%—erasing all of 2018’s gains in the process.
How did we get here?
In my view, the stock market decline was the inevitable correction of two imbalances that have been in place since August 2017. One imbalance resulted from the stock market’s lack of attention to the sharp rise in bond yields. The other was the product of the stock market gaining twice as much as was justified by the recent tax cut, which led to an abrupt increase in earnings estimates.
Last August was a pivotal time for the market because that’s when the probability of tax cuts started to get priced into stocks again. From August 2017 through its highest point in late January 2018, the S&P 500 rallied 457 points. The problem with that rally was that only half of it was justified by the earnings windfall from the tax cuts.
The conventional wisdom on Wall Street has been that the corporate tax cuts are worth around $2 per share per percentage point in the effective tax rate, or $10 per share in total if the effective tax rate declines from 26% to 21%. So with the S&P 500 at a price-to-earnings (P/E) ratio of 20, that equates to a gain of around 200 points in the index ($10 x 20 = 200 points). Instead, the market rallied 450 points, with the other 250 points coming from P/E expansion.
A rally in the stock market because of stronger earnings growth is completely justified, since stock prices tend to follow earnings. And, according to the discounted cash flow model (DCF),1 even an expansion of the P/E ratio makes sense if the increase in earnings growth is sustained (which it presumably would be in this scenario since the tax cuts are permanent).
But the problem is that valuation multiples are already elevated as a result of the unconventional monetary policy of the post-2008 era. This has pushed down interest rates and, at the same time, driven up the valuations of pretty much all asset classes, including equities. On top of that, the equity risk premium2 has fallen to 2%, which is by no means a record low but well below the long-term average of 4%.
So, between a suppressed risk-free rate and a below- average risk premium, the overall discount rate that is used to calculate the present value of future earnings growth is quite low at 4.8%, which in turn has led to rich valuations for equities. If the discount rate was a more typical 6% to 7%, the P/E ratio would be several points lower.
At its recent high, the market’s P/E ratio (using trailing earnings) had climbed to 22x and the forward P/E (using expected earnings) had reached 19x. Those were the highest levels since 1999 and more than two P/E points above the levels from last August, when this latest rally kicked off. In my view, to argue that P/E ratios should expand even further because of the tax cuts is technically correct but hard to justify, given how elevated valuation levels already are. The second imbalance was just a simple matter of the stock market ignoring the bond market. Interest rates—and liquidity conditions in general—are an essential piece of the equity valuation puzzle, along with earnings. The combination of earnings growth and liquidity conditions tends to drive valuations higher or lower, and since early 2016 the stock market has enjoyed a simultaneous surge in earnings growth and a sharp easing of financial conditions.3
That easing of financial conditions occurred despite five interest rate hikes by the Federal Reserve (the Fed), with another six increases signaled through the end of 2019, in addition to a gradual reduction in the Fed’s balance sheet. The yield on the 10-year Treasury has now more than doubled off its historic low of 1.32% in July 2016. As of February 12, the 10-year yield climbed to 2.87%, which is up 86 basis points since last August’s 2.01% low.
Amid the euphoria of the explosive growth in corporate earnings, it has been clear that the markets were too complacent about the other side of that trade, which is that adding fiscal stimulus to an economy that is operating at full capacity nine years into an expansion might just create a classic late-cycle overheating phase, with all the implications therein for the Fed, interest rates, the yield curve, and the risk premium. Thus, a yield of 2.01% last August didn’t make much sense in retrospect.
Like vegetables, a correction can be good for you So where does this leave us now? The good news from my perspective is that these two imbalances—rising rates being ignored by the stock market and valuation multiples increasing beyond what can be justified—have now mostly been remedied by the recent stock market correction.
For one, the market has completely given back its two-point valuation increase since last August. The trailing P/E is now back to 20x and the forward P/E is back to 17x. Second, the bond market has now gone from pricing in one more Fed rate hike over the next two years to pricing in over four more hikes. Predicting interest rates is a notoriously difficult exercise, but my guess is that with its yield near 3%, the 10-year Treasury is a lot closer to some sort of equilibrium than it has been in several years. At 3% or so, bond yields are consistent with another four or five Fed hikes, and that seems like a reasonable bet for this Fed cycle.
So, between these two adjustments the market now seems to be in much better balance, with strong earnings growth pushing the market higher, but rising rates acting as a valuation headwind.
This is a market regime wherein stock prices should rise less than earnings, not more than earnings as has been the case for years. With earnings up strongly, this is still a bull market scenario, albeit a more mature one than before.
A technical milestone
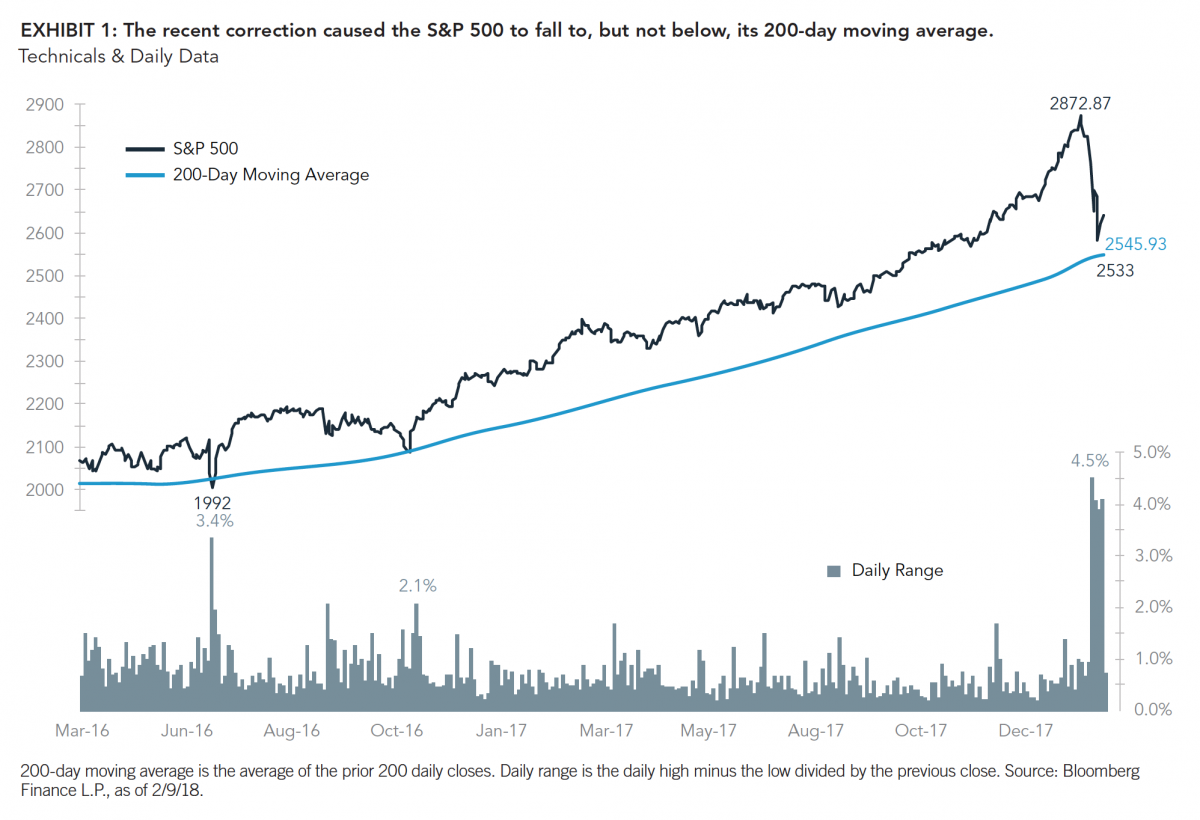
At its February 9 low after a 10-day, 340-point decline, the S&P 500 Index reached its 200-day moving average at 2546 (see Exhibit 1, page 3), and bounced sharply to close the week at 2620. This is an important technical milestone because bull market corrections have often produced a decline of 10% to 15% right down to the 200-day moving average before resuming its uptrend.
Exhibit 1 also illustrates the recent turbulence in the market’s daily range, clearly showing the change from months of low volatility to suddenly very high volatility.
Typically, there will be an initial sharp bounce off that momentum low into a retracement4 zone, which is generally between 38% and 62% of the preceding decline. For this market that resistance zone comes in at 2663 to 2746 for the S&P 500 index. This is the zone where some backing and filling usually occurs, which, based on past market correction history, could happen in the coming days or weeks. There may also be a retest of the low, as would be consistent with past corrections.
Either way, whether the correction ended on February 9 or continues for several more weeks is unknowable. But the good news is that bond yields appear to be in much better sync with the Fed; the stock market appears to have given back its valuation bump; the stock market is paying attention to the bond market again (as well it should); and we’re still seeing double-digit earnings growth.
All in all, that makes me feel a lot more comfortable about where the market is and where it is likely to go.
Author
Jurrien Timmer | Director of Global Macro, Fidelity Global
Asset Allocation Division Jurrien Timmer is the director of Global Macro for the Global Asset Allocation Division of Fidelity Investments, specializing in global macro strategy and tactical asset allocation. He joined Fidelity in 1995 as a technical research analyst.
For Canadian investors
For Canadian prospects and/or Canadian institutional investors only. Offered in each province of Canada by Fidelity Investments Canada ULC in accordance with applicable securities laws. Endnotes
1. The discounted cash flow model is a method of valuation in which future cash flows are discounted back to a present value using the time-value of money, which states that money is worth more in the present than the same amount in the future.
2. Equity risk premium is the difference between returns on stocks and the risk-free rate of return, which is typically benchmarked to longer-term government bonds (such as U.S. Treasuries) assuming zero default risk by the government.
3. As measured by the Goldman Sachs Financial Conditions Index, a weighted sum of a short-term bond yield, a long-term corporate yield, the exchange rate, and a stock market variable. An increase in the index indicates a tightening of financial conditions, and a decrease indicates an easing of financial conditions.
4. A retracement is a temporary reversal in the direction of stock prices that goes against the prevailing trend. A retracement does not signify a change in the larger trend.
Unless otherwise disclosed to you, any investment or management recommendation in this document is not meant to be impartial investment advice or advice in a fiduciary capacity, is intended to be educational, and is not tailored to the investment needs of any specific individual. Fidelity and its representatives have a financial interest in any investment alternatives or transactions described in this document. Fidelity receives compensation from Fidelity funds and products, certain third-party funds and products, and certain investment services. The compensation that is received, either directly or indirectly, by Fidelity may vary based on such funds, products, and services, which can create a conflict of interest for Fidelity and its representatives. Fiduciaries are solely responsible for exercising independent judgment in evaluating any transaction(s) and are assumed to be capable of evaluating investment risks independently, both in general and with regard to particular transactions and investment strategies.
Information presented herein is for discussion and illustrative purposes only and is not a recommendation or an offer or solicitation to buy or sell any securities.
Views expressed are as of the date indicated, based on the information available at that time, and may change based on market and other conditions. Unless otherwise noted, the opinions provided are those of the author and not necessarily those of Fidelity Investments or its affiliates. Fidelity does not assume any duty to update any of the information.
Investment decisions should be based on an individual’s own goals, time horizon, and tolerance for risk.
Nothing in this content should be considered to be legal or tax advice, and you are encouraged to consult your own lawyer, accountant, or other advisor before making any financial decision.
Stock markets, especially non-U.S. markets, are volatile and can decline significantly in response to adverse issuer, political, regulatory, market, or economic developments. Foreign securities are subject to interest rate, currency exchange rate, economic, and political risks, all of which are magnified in emerging markets.
Investing involves risk, including risk of loss. Past performance is no guarantee of future results. Diversification and asset allocation do not ensure a profit or guarantee against loss.
All indices are unmanaged. You cannot invest directly in an index.
Index definitions
Standard & Poor’s 500 (S&P 500®) Index is a market capitalization-weighted index of 500 common stocks chosen for market size, liquidity, and industry group representation to represent U.S. equity performance. S&P 500 is a registered service mark of the McGraw-Hill Companies, Inc., and has been licensed for use by Fidelity Distributors Corporation and its affiliates. Third-party marks are the property of their respective owners; all other marks are the property of Fidelity Investments Canada ULC.
Goldman Sachs Financial Conditions Index tracks changes in interest rates, credit spreads, equity prices, and the value of the U.S. dollar. A decrease in the index indicates an easing of financial conditions, while an increase indicates tightening.
© 2018 Fidelity Investments Canada ULC. All rights reserved. US: 834598.1.0 CAN: 836170.1.0
Copyright © Fidelity Investments Canada