
by Lance Roberts, Clarity Financial
As the markets push once again into record territory the question of valuations becomes ever more important. While valuations are a poor timing tool in the short term for investors, in the long run, valuation levels have everything to do with future returns.
Yesterday, Doug Kass penned an interesting note on the current market advance:
“Consistently advancing and uninterrupted rising stock prices have a way of spreading fallacious arguments not grounded in fact. Here are some recent examples of that meme — namely, of an earnings-driven market.
This is the new meme, but it increasingly resembles ‘Group Stink.’
Contrary to the pablum delivered by many in the business media, the rise in stocks over the last 12 predominantly has been a valuation-driven story, just as it was in 2016 when S&P 500 profits were up 5% and the S&P Index rose by about 11%.
And going back even further, since 2012 S&P earnings have risen by 30% compared to an 80% rise in the price of the S&P lndex.”
The current belief is the market will surge even higher as a result of corporate “tax cuts” which further boost corporate profits. While the estimates of higher profits via tax cuts is obvious, the question remains as to how much of any tax cut received by corporations is already priced in? More importantly, is the sustainability of the growth of earnings going forward.
John Hussman, via Hussman Funds, once penned:
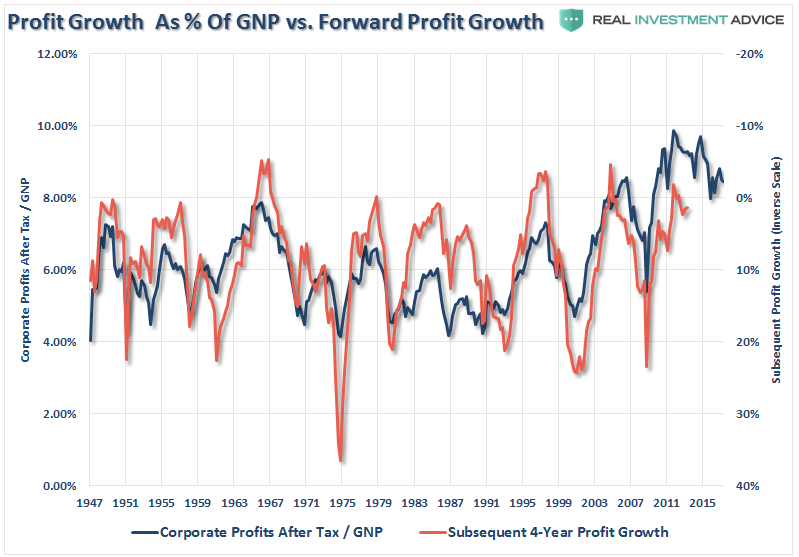
“I’ve noted frequently that after-tax corporate profits as a share of national income are about 70% above historical norms; that these profit shares are heavily mean-reverting and strongly (inversely) associated with subsequent profit growth over the following 3-4 year period; and that the current surplus of corporate profits is the mirror-image of corresponding deficits in household and government savings (a relationship detailed in prior weekly comments). Recent profits data, as well as the entire historical record, are tightly explained by these factors.
Notably, this data is derived from the national income accounts computed by the Bureau of Economic Analysis, and it’s worth understanding how the BEA computes profits. Specifically, the BEA points out, ‘Because national income is defined as the income of U.S. residents, its profits component includes income earned abroad by U.S. corporations and excludes income earned in the United States by foreigners.’”
The chart below shows corporate profits, per the BEA, divided by GDP. (You can substitute GNP but the result is virtually identical between the two measures.)
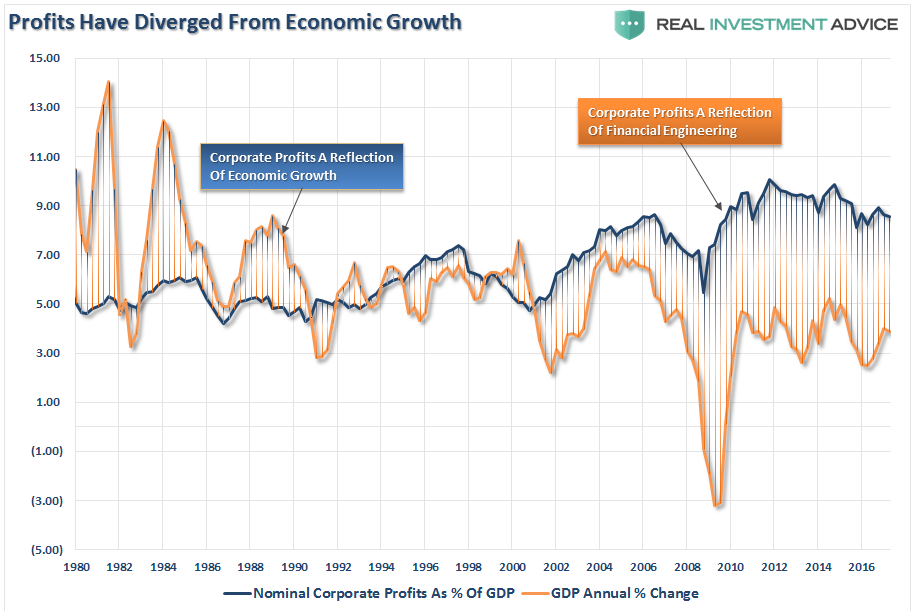
Note, that while operating earnings per share are hitting a record this quarter, reported corporate profits after tax have not. The difference comes from the accounting gimmicks used to report higher earnings while the profits on which tax is paid is an entirely different matter. Furthermore, corporate profits should be a reflection of the underlying economic strength, but due to financial engineering, wage and employment suppression and increase in productivity, they have become extremely deviated.
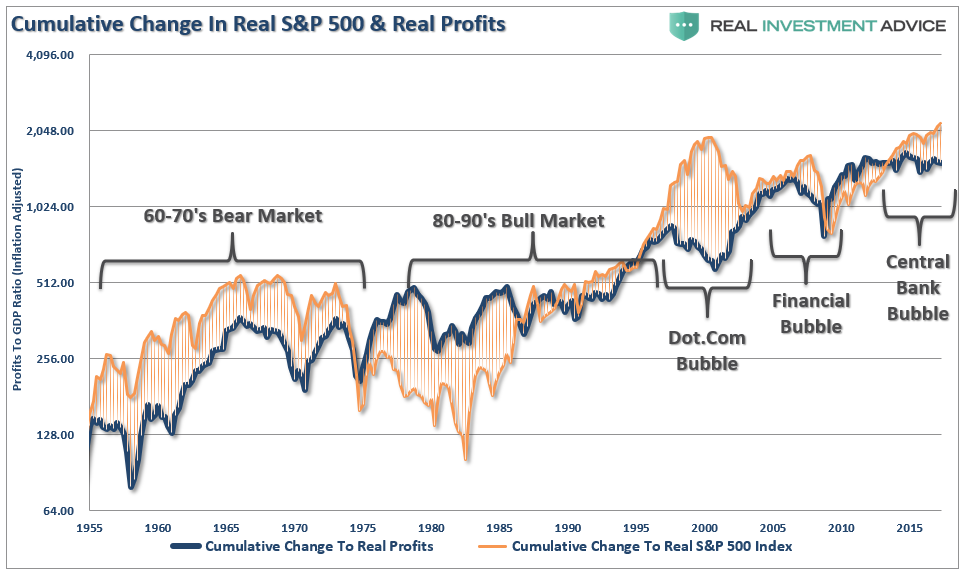
This deviation begs the question of sustainability. The chart below is an expansion of the real, inflation-adjusted, profits after-tax versus the cumulative change to the S&P 500. Here is the important point – when markets grow faster than profitability, which it can do for a while, eventually a reversion occurs. This is simply the case that all excesses must eventually be cleared before the next growth cycle can occur. Currently, we are once again trading a fairly substantial premium to corporate profit growth.
Again, since corporate profit growth should be a function of economic growth longer term, we can also see how “expensive” the market is relative to corporate profit growth as a percentage of economic growth. Once again, we find that when the price to profits ratio is trading ABOVE the long-term linear trend, markets have struggled and ultimately experienced a more severe mean reverting event. With the price to profits ratio once again elevated above the long-term trend, there is little to suggest that markets haven’t already priced in a good bit of future economic and profits growth.
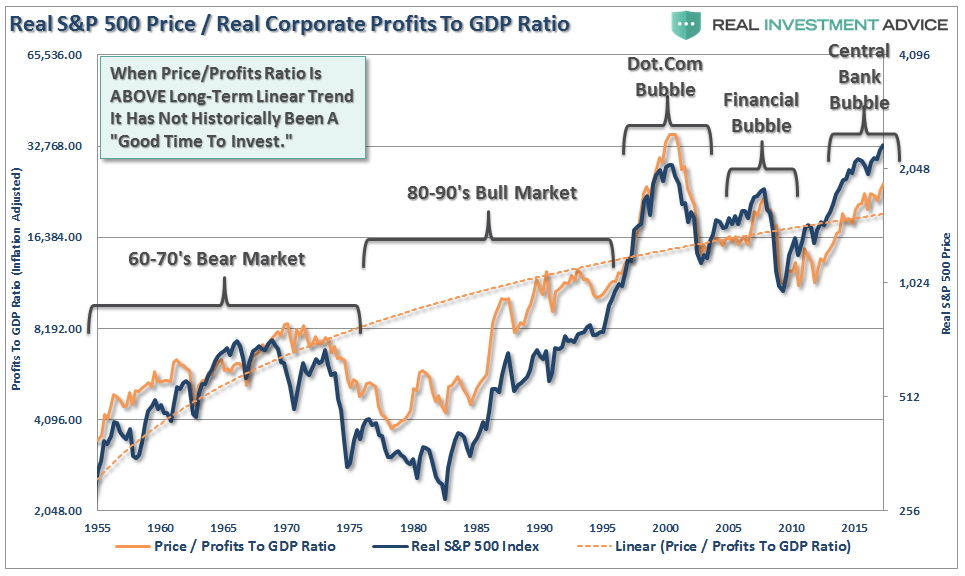
While none of this suggests the market will “crash” tomorrow, it is supportive of the idea that future returns will substantially weaker than in recent years.
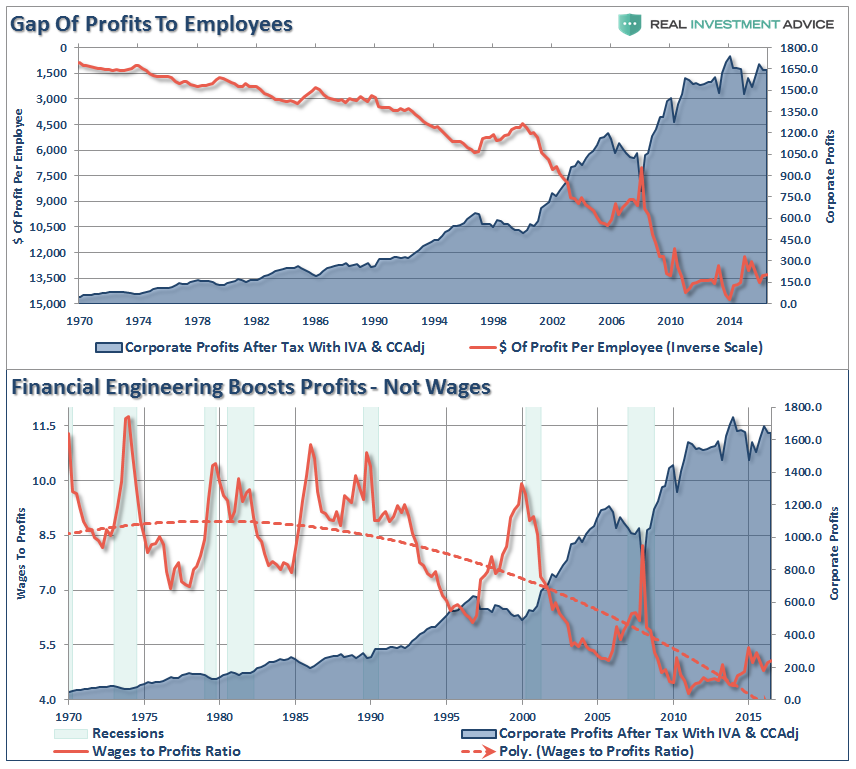
The sustainability of corporate profits is dependent on two primary factors; sustained revenue growth and cost controls. From each dollar of sales is subtracted the operating costs of the business to achieve net profitability. The chart below shows the percentage change of sales, what happens at the top line of the income statement, as compared to actual earnings (reported and operating) growth.
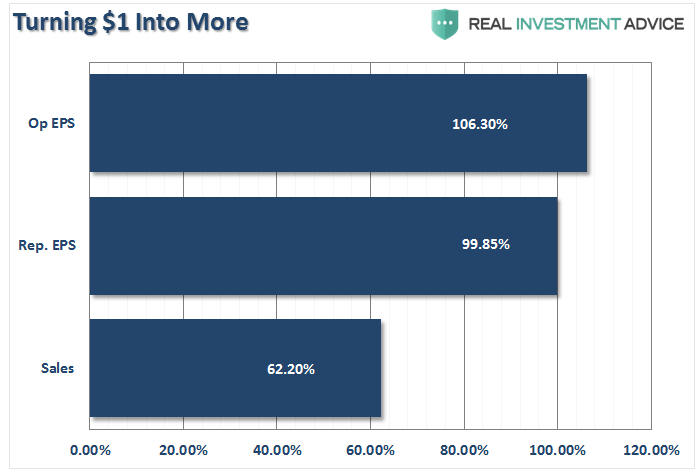
Since 2000, each dollar of gross sales has been increased to more than $1 in operating and reported profits through financial engineering and cost suppression. The next chart shows that the surge in corporate profitability in recent years is a result of a consistent reduction of both employment and wage growth. This has been achieved by increases in productivity, technology, and off-shoring of labor. However, it is important to note that benefits from such actions are finite.
(Note the acceleration in profits starting with the Reagan Tax Cuts in the 1989’s. There is no evidence that cutting taxes for corporations leads to higher wages for employees.)
Given the economic landscape of recent years, large offsetting sectoral deficits and surpluses are not surprising, but they should not be taken as evidence that the long-term profitability of the corporate sector has permanently shifted higher. Stocks are not a claim to a few years of cash flows, but decades and decades of them. By pricing stocks as if current profits are representative of the indefinite future, investors have ensured themselves a rude awakening over time. Equity valuations are decidedly a long-term proposition, and from present levels, the implied long-term returns are quite dim.
The chart below (CPATAX/GNP) provides a good summary of the present situation, and a reasonable sense of what we expect for corporate profit growth over the coming several years.”
As we know from repeatedly from history, extrapolated projections rarely happen. Could this time be different? Sure. However, believing that historical tendencies have evolved into a new paradigm will likely have the same results as playing leapfrog with a Unicorn.
There is mounting evidence, from valuations being paid in M&A deals, junk bond yields, margin debt and price extensions from long-term means, “irrational exuberance” is once again returning to the financial markets. However, such does not mean a mean reversion process is imminent. It was in 1996 when Alan Greenspan first uttered those famous words, it was 4 years later before investors regretted not paying attention them. It is likely that the same will be true this time. With the Central Banks still pushing liquidity into the markets, there is little to deter the “bullish bias” presently. However, as noted above, investors that fail to heed the warning signs will likely ensure themselves a rude awakening over time.
Copyright © Clarity Financial