
by Bryce Coward, CFA, Knowledge Leaders Capital
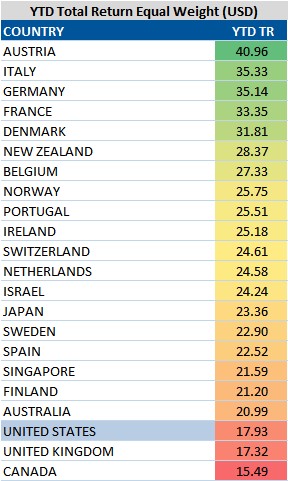
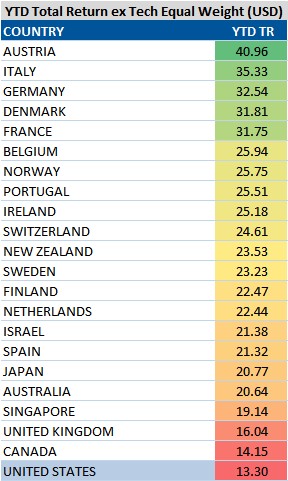
Over the last decade US stocks have outperformed the global equity benchmark by about 35% and have outperformed in eight of the last ten years prior to 2017. But that may all be coming to an end. Indeed, so far in 2017 the United States is the third worst performing developed market country (table 1) even as it has turned in a solid 17.9% on an equal weighted basis. Excluding the information technology sector, the United States is THE worst performing market among developed countries, bringing in about 13% versus an average of about 20% on an equal weighted basis (table 2). Below we show a few fundamental factors that suggest international stocks may be the place to be for the foreseeable future.
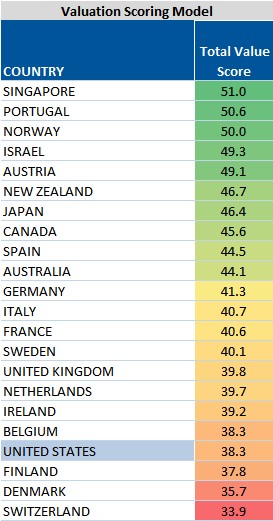
First, valuations. Whether from a bottom-up perspective or top-down perspective, US stocks are expensive relative to the rest of the world. The below table shows our proprietary valuation scoring model aggregated by country. The model assigns a score to each stock based on a variety of important absolute and relative valuation metrics, which we then roll up into a country average. A higher score indicates a more attractive valuation. As the table shows, American stocks are, on average, only cheaper than Finish, Danish and Swiss stocks.
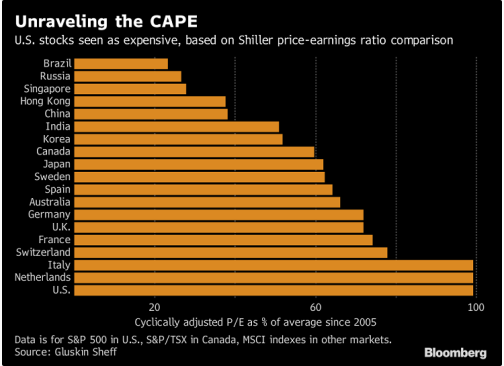
This next chart, borrowed from Gluskin Sheff via Bloomberg, shows a more traditional top-down valuation indicator, the Shiller PE ratio. The Shiller PE ratio is sometimes referred to as the cyclically adjusted PE because it uses the trailing ten year average earnings as the denominator. The chart below depicts each country’s Shiller PE as a ratio of each country’s average Shiller PE since 2005. The interpretation is that the US market is the most expensive major market relative to its own history and is currently trading at about twice its average valuation level.
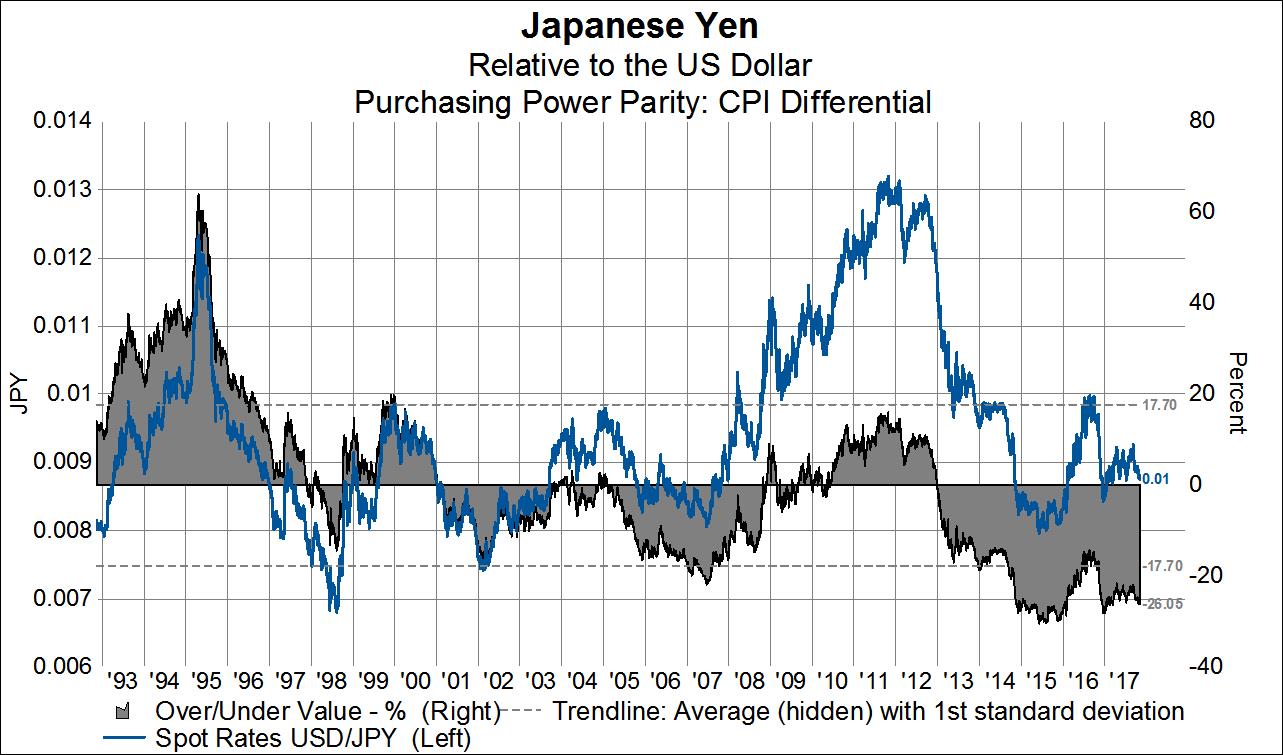
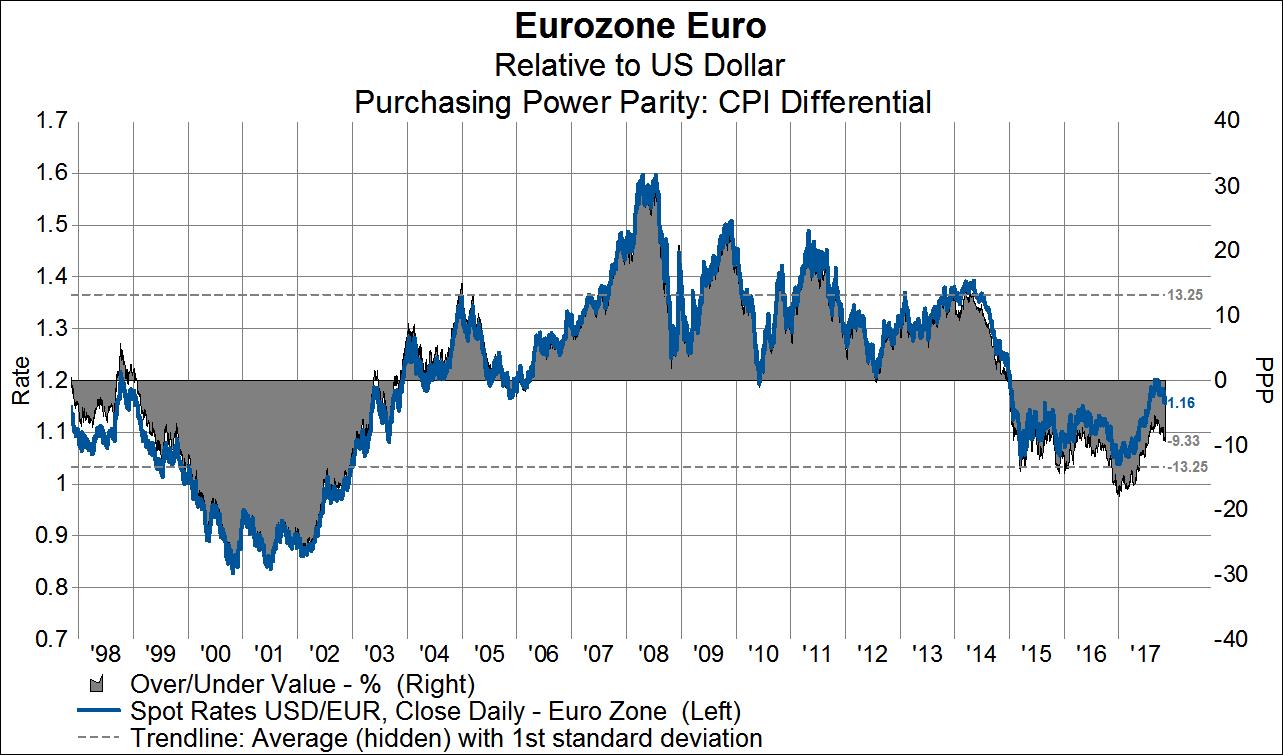
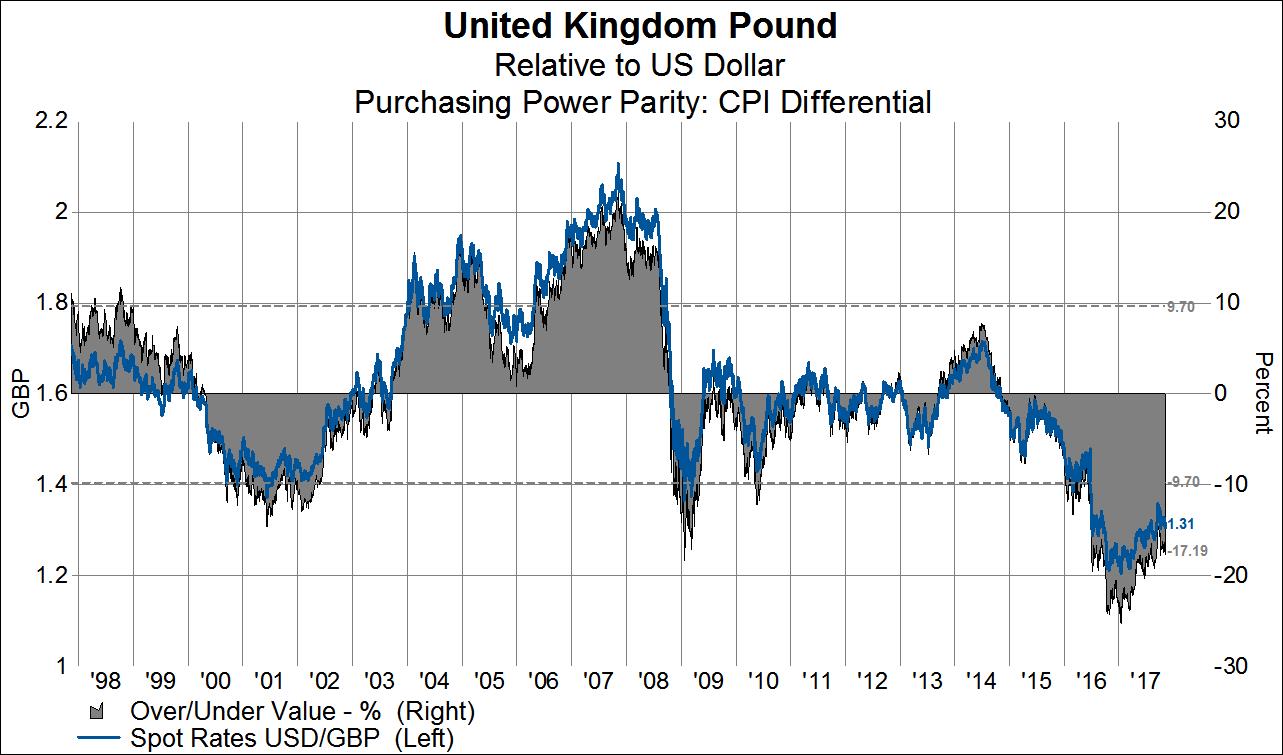
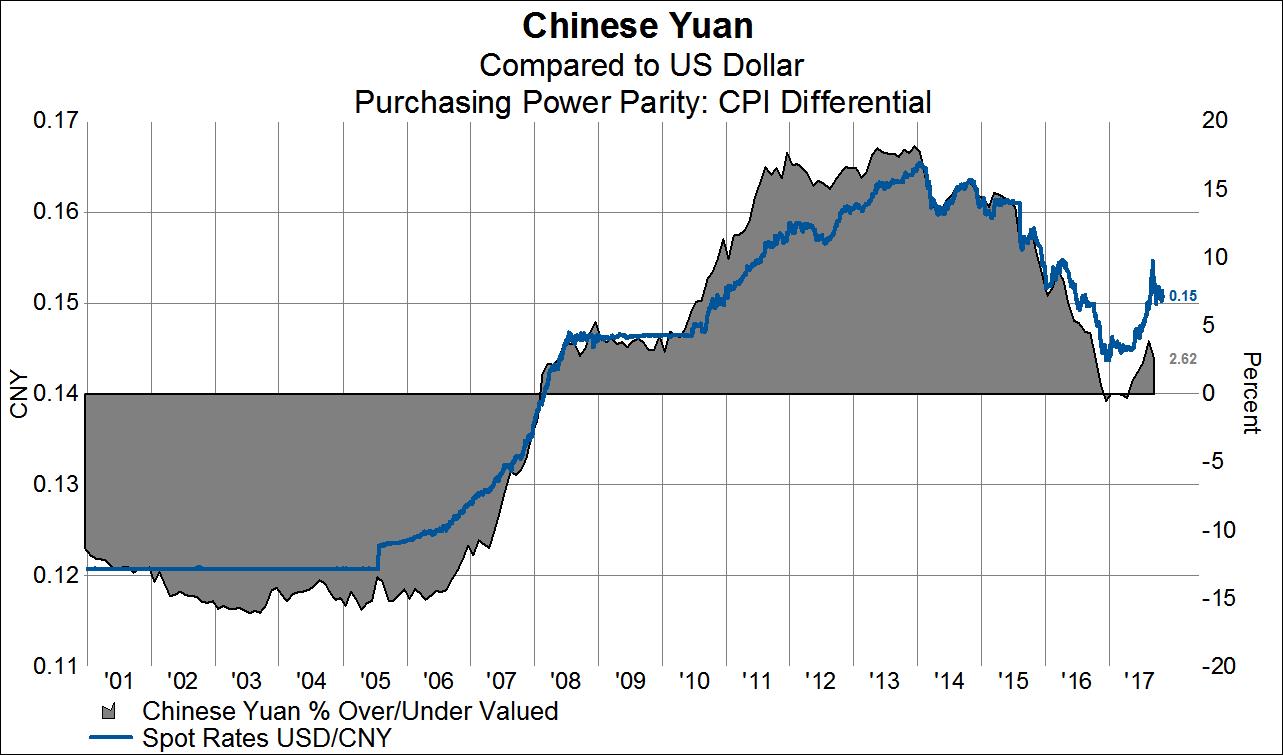
Next up is the US dollar. The US dollar was in a bear market from 2001 through 2008 and was a big driver of the roughly 25% cumulative undperformance (in USD terms) of US stocks over that period. From 2008 through 2016 the US dollar was in a bull market and acted as a big driver of US stock outperformance (in USD terms) over that period. After a nine year bull market in the US dollar, we’re now at a point where the US dollar has achieved significant overvaluation relative to the major trading currencies. One way we can measure relative valuations of currencies is by employing a purchasing power parity model, which essentially determines a currency’s relative valuation by considering the relative price level of goods and services between two countries. The model assumes that currency levels will, over time, adjust to compensate for price level differentials between two countries. As we can see in the charts below, the yen is currently undervalued against the USD by 26%, the euro is undervalued by 9%, the pound is undervalued by 17% and the yuan is fairly valued for the first time since 2007. These data suggest that the slide the USD has seen so far in 2017 could continue for quite awhile before parity is achieved on a purchasing power basis.
Whether valuations, the USD or other fundamental factors we’ve discussed before, our analysis suggests the relative rout in US stocks we’ve seen so far in 2017 could last for some time. For investors, this means it’s not too late to start over-weighting foreign markets, and that such a decision may be necessary to keep up with international benchmarks in the years to come.
Copyright © Knowledge Leaders Capital