by Jeffrey Saut, Chief Investment Strategist, Raymond James
“Successful investing is anticipating the anticipations of others”
The actual private object of most skilled investment today is to ‘beat the gun.’ As Americans so well express it, to outwit the crowd and to pass the bad, or depreciating halfcrown, to the other. For it is, so to speak, a game of Snap, of Old Maid, of Musical Chairs – a pastime in which he is the victor who plays ‘snap’ neither too soon nor too late, who passes the old maid to his neighbor before the game is over, who secures a chair for himself when the music stops. Or to change the metaphor slightly, professional investment may be likened to those newspaper competitors in which the competitors have to pick out the six prettiest faces from a hundred photographs, the prize being awarded to the competitor whose choice most nearly corresponds to the average preferences of the competitors, as a whole; so that each competitor has to pick not those faces which he himself finds prettiest, but those which he thinks likeliest to catch the fancy of the other competitors, all of whom are looking at the problem from the same point of view. We have reached the third degree where we devote our intelligences to anticipating what the average opinion expects the average opinion to be. And there are some, I believe, who practice the fourth, fifth and higher degrees.”
John Maynard Keynes, The General Theory of Employment, Interest and Money – 1935
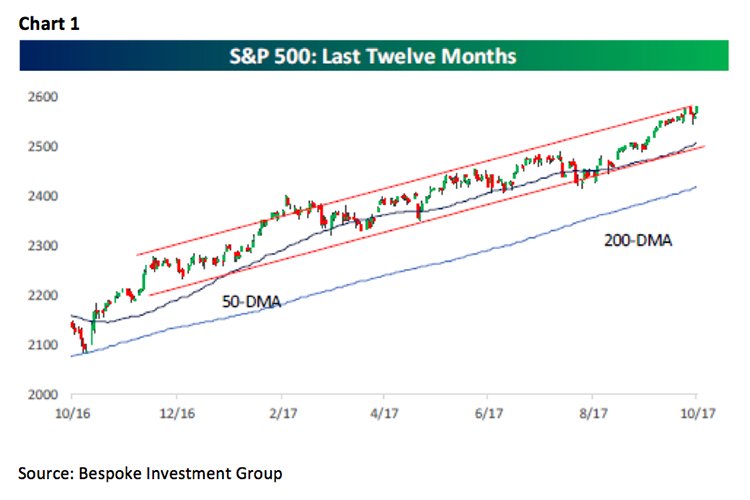
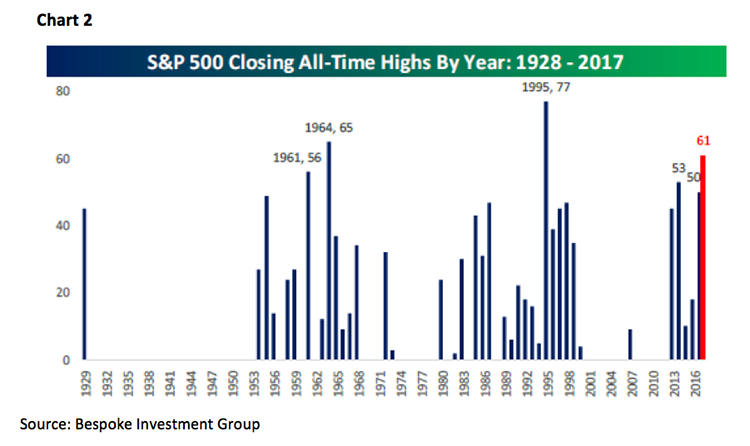
We have used the aforementioned quote many times over our nearly 50 years in this business, but surprisingly, it is just as relevant now as it was when first written. Bet it surprised you that the quote is dated 1935! Read it a few times away from the maddening crowd and reflect on it, because certain phrases will grab you with their wisdom. Bet you also thought that it brings back vivid memories of the 1987 Crash, as well as more recent Dow Dives and nostalgic personal wishes like, “If only I had ‘beaten the gun,’ or ‘Passed the old maid,’ in time to avoid the final ‘snap’!” However, for nearly one year, investors have not had to “pass the old maid”, because there has not been so much as a 5% correction. To be sure, the last 5% correction was going into the presidential election when the S&P 500 (SPX/2581.07) fell from its August 15, 2016 high of 2193.81 to its November 4, 2016 low of 2083.79 (chart 1 on page 2). Going a year without a 5% correction is quite a rare feat and has only happened six times since 1950. The current upside skein has produced 50 record closing highs for the SPX year to date and is on a pace that could produce 61, which would be the third most ever (chart 2 on page 3).
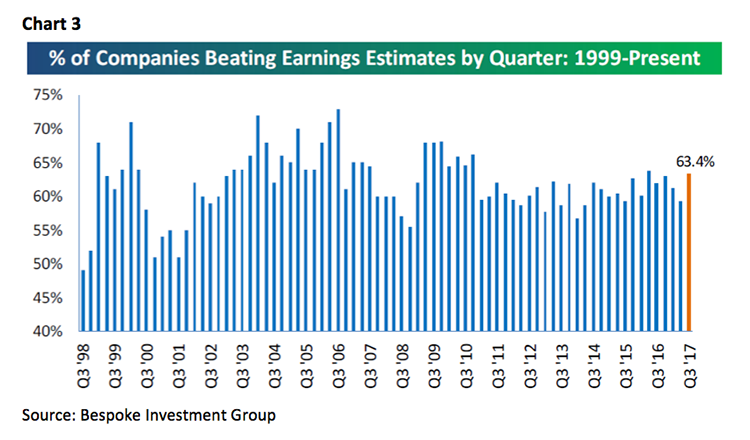
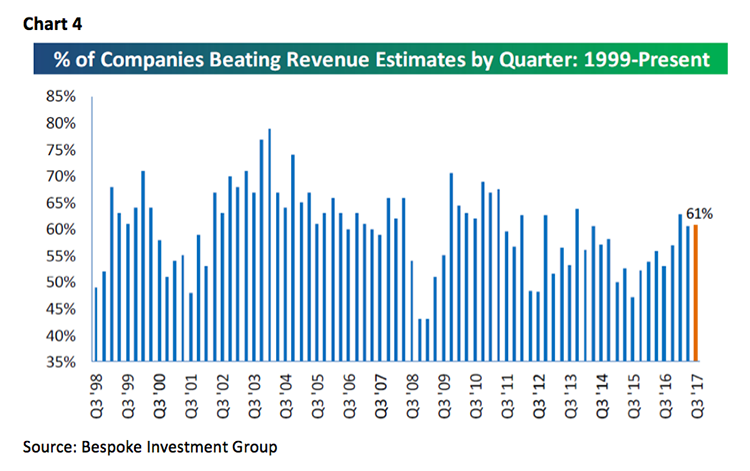
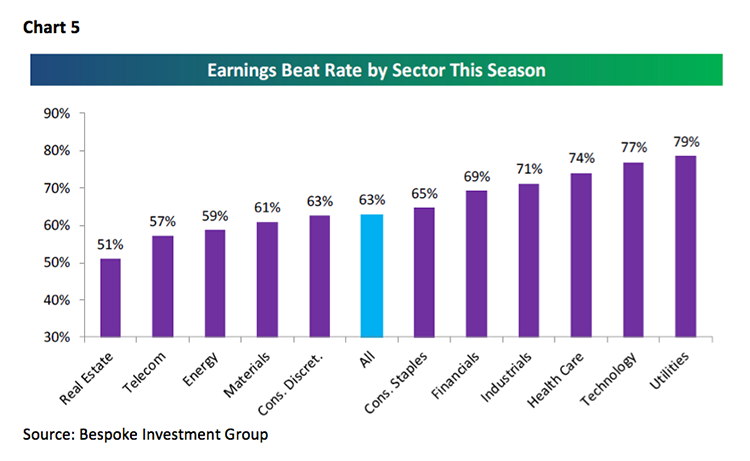
Obviously an improving economy, and better earnings, are the drivers of the SPX’s surge, which is exactly what is supposed to happen in the second leg of a secular bull market. So far in this earnings season, 63.4% of reporting companies have beaten estimates and 61.0% have bettered revenue estimates (charts 3 & 4 on page 3). The earnings beat rate by sector shows that Consumer Staples, Financials, Industrials, Technology, and Utilities have shown the highest number of “beats” (chart 5 on page 4). As usual, we screen those reporting companies for names that have beaten earnings and revenue guidance, raised forward earning’s guidance, have favorable ratings from our fundamental analysts, and look good on our proprietary algorithm models. So far those names from the Raymond James research universe having those metrics include: TD Ameritrade (AMTD/$50.51/Outperform), GrubHub (GRUB/$60.02/Outperform), Johnson & Johnson (JNJ/$141.78/ Outperform), LKQ (LKQ/$36.74/Outperform), ServiceNow (NOW/$125.73/Strong Buy), PRA Health Sciences (PRAH/$82.04/Outperform), and S&P Global (SPGI/$162.16/Outperform).
Moving on to the economy, our economist had this to say about last Friday’s GDP report:
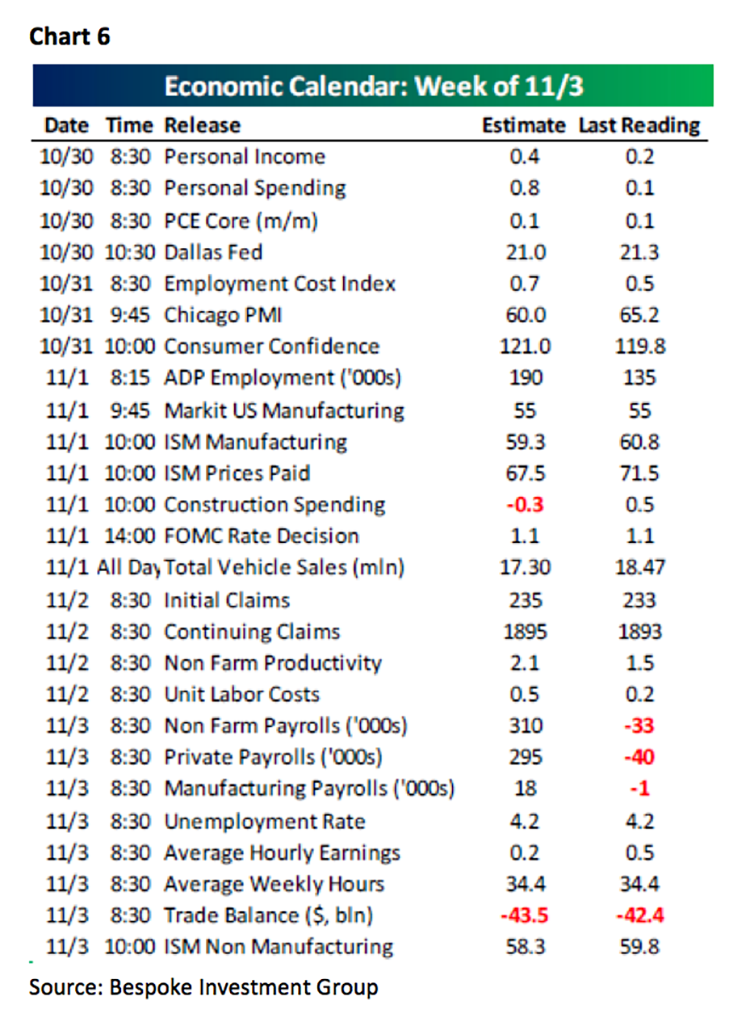
The headline figure was stronger than anticipated, but well within the usual range of uncertainty, with inventory providing a somewhat larger-than-expected contribution. Hurricanes had an impact, but the BEA can’t say precisely how much. Consumer spending slowed (but was helped by clearance promotions in motor vehicles). Business fixed investment slowed, partly reflecting a softening in energy exploration (hurricane related). Homebuilding weakened further (still up y/y). Inventories rose at a faster pace, adding 0.7 percentage point to the headline GDP figure, while a smaller trade deficit added 0.4 percentage point. Private domestic final purchases, the best measure of underlying domestic demand, slowed to a 2.2% pace, but that reflects some restraint from the hurricanes. In short, nothing too surprising in the details, and bear in mind that this is the advance estimate (figures will be revised, but the story shouldn’t change much). Markets still waiting on Trump’s decision on the next Fed chair, with expectations building for Powell (a comfortable choice for the markets). Busy economic calendar next week (chart 6 on page 4).
Hereto, this pickup in economic strength is what is supposed to happen in the second leg of a secular bull market. And for all of those who keep asking us how long the second leg will last, it is unknowable. The first leg of the 1982-2000 secular bull market ended with the Crash of 1987. The second leg began shortly after the Crash an ended in 1994. The third leg started in early 1995 and ended mid-January 2000. We will say this: whenever the second leg ends, there will be another upside consolidation just like there was between May 2015 and February 2016. And just like in that period, the negative nabobs will come out of the woodwork telling everyone that there is going to be a crash, the economy is going into a recession, earnings are going to tank, etc.
Speaking to last Friday’s action, it was a rather unusual session with the NASDAQ 100 gaining 2.9% and the SPX gaining 0.81% but the D-J Industrial Average only rallying 0.14%. Moreover, as Jason Goepfert of SentmenTrader fame writes:
A singular market. We’re seeing market readings that have been seen only a few times in history, if ever. Among the examples, the S&P 500 surged to a new high on Friday, but was powered by the 3rd-fewest number of its stocks in 27 years. Tech stocks are an even more stark example. The Nasdaq 100 was even more extreme in terms of its price gains being driven by relatively few stocks. It hasn’t had such a big price gain, with so few advancing stocks in the index, since 2000. Not only that, its price move – the largest gain in a year to a 52-week high – is comparable only to other blow-offs.
Now Investopedia defines a “blow off top” as, “A chart pattern that indicates a steep and rapid increase in a security’s price and trading volume followed by a steep and rapid drop in price and volume. The rapid changes indicated by a blow-off top, also called a blow-off move or exhaustion move, can be the result of actual news or pure speculation.”
The call for this week: If we are going to finally get a trading top, it should come this week.
Additional information is available on request. This document may not be reprinted without permission.
Raymond James & Associates may make a market in stocks mentioned in this report and may have managed/co-managed a public/follow-on offering of these shares or otherwise provided investment banking services to companies mentioned in this report in the past three years.
RJ&A or its officers, employees, or affiliates may 1) currently own shares, options, rights or warrants and/or 2) execute transactions in the securities mentioned in this report that may or may not be consistent with this report’s conclusions.
The opinions offered by Mr. Saut should be considered a part of your overall decision-making process. For more information about this report – to discuss how this outlook may affect your personal situation and/or to learn how this insight may be incorporated into your investment strategy – please contact your Raymond James Financial Advisor.
All expressions of opinion reflect the judgment of the Equity Research Department of Raymond James & Associates at this time and are subject to change. Information has been obtained from sources considered reliable, but we do not guarantee that the material presented is accurate or that it provides a complete description of the securities, markets or developments mentioned. Other Raymond James departments may have information that is not available to the Equity Research Department about companies mentioned. We may, from time to time, have a position in the securities mentioned and may execute transactions that may not be consistent with this presentation’s conclusions. We may perform investment banking or other services for, or solicit investment banking business from, any company mentioned. Investments mentioned are subject to availability and market conditions. All yields represent past performance and may not be indicative of future results. Raymond James & Associates, Raymond James Financial Services and Raymond James Ltd. are wholly-owned subsidiaries of Raymond James Financial.
International securities involve additional risks such as currency fluctuations, differing financial accounting standards, and possible political and economic instability. These risks are greater in emerging markets.
Investors should consider the investment objectives, risks, and charges and expenses of mutual funds carefully before investing. The prospectus contains this and other information about mutual funds. The prospectus is available from your financial advisor and should be read carefully before investing.
Copyright © Raymond James