Market Risk Factors: Theory and Practice
by Commonwealth Financial Network
 When thinking about market risk factors we should worry about, the list is quite extensive. Just googling “economic statistics,” for example, will give you about 365 million results. If you search “stock market statistics,” you’ll get only 8.5 million hits. The question, then, is how can we refine the data points to determine which indicators truly belong on our risk radar?
To answer this question, we need to think about things from a fundamental perspective. In other words, what drives the market? First, of course, is the base economy. After all, 8 of 10 bear markets occurred during a recession, so we have to consider the economy itself.
Consumer spending and business investment are the major variables affecting the economy’s performance. Digging a bit deeper, we find that the drivers of consumer spending are job growth (for the ability to spend) and consumer confidence (for the willingness to do so). Similarly, business investment is driven by business confidence. Both job growth and consumer confidence are also affected by financial conditions (e.g., interest rates). Theoretically, these metrics make sense as risk indicators. But do they work in practice?
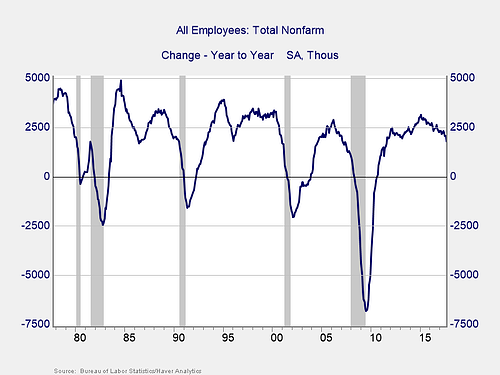
Job growth. As illustrated in the chart below, we’ve had a recession five out of the past five times when year-on-year job growth dropped below zero. When considering job growth today, keep in mind that recession start dates are set in retrospect. So, when the change hit zero the last time, it would have been a good predictor. This is a metric that works in both theory and practice.
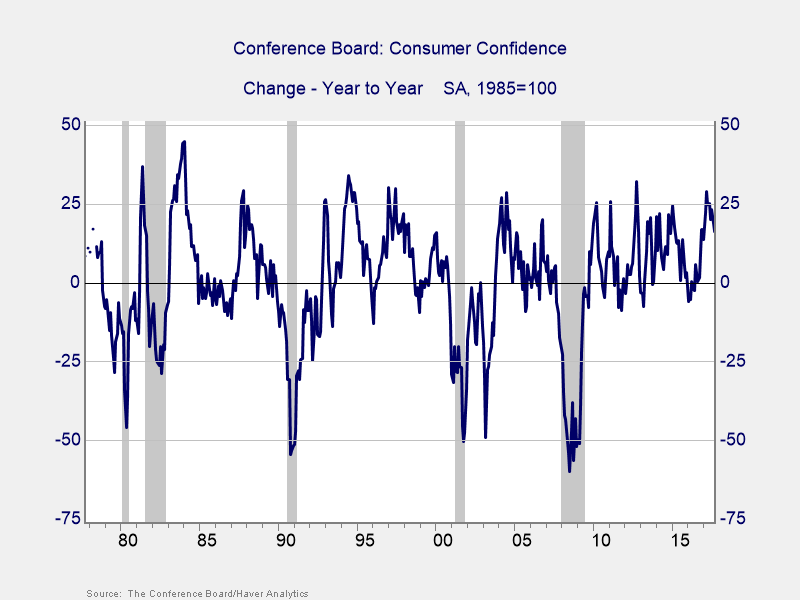
Consumer confidence. Similarly, when consumer confidence declined by more than 20 points over a year, it has signaled five out of the five past recessions. It should be noted that this indicator has had a couple of false signals (in the early 1990s and 2000s) when the economy slowed but did not tip into recession. Still, it works in both theory and practice.
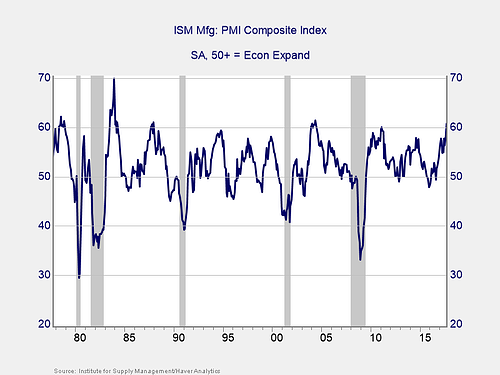
Business confidence. As shown in the chart below from the Institute for Supply Management (ISM) Manufacturing survey, business confidence has a five-for-five record of signaling recession when it drops below about 45. I use the ISM Nonmanufacturing survey in the monthly market risk update I publish on my blog, The Independent Market Observer. It covers more of the economy but has a shorter track record. Here, I’m using the index that has a much longer record, and it supports the idea that business confidence is a good indicator of recession risk.
Interest rates. Last but not least, the yield curve shows us that when short-term interest rates rise above long-term rates (as shown in the next chart when the line dips below zero), we have a four-for-four recession prediction record. Once again, practice matches theory.
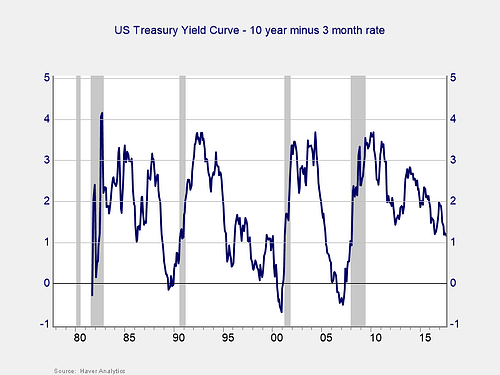
Overall, none of these indicators is even close to the trouble zone. From an economic standpoint, risk of a recession—and, therefore, risk of a severe pullback in the stock market—remains low.
Of course, the stock market has its own risks, which we also need to track and respond to. These risks come in three flavors: recession risk, economic shock risk, and risks within the market itself. We already covered recession risks, so let’s take a look at the other two.
There are two major systemic factors—the price of oil and the price of money (better known as interest rates)—that drive the economy and the financial markets and that have a proven ability to derail them. Both have been causal factors in previous bear markets and warrant close attention.
Oil prices. This factor typically causes disruption when it spikes. The rising price of oil is a warning sign of both a recession and a bear market. In the next chart, you can see that spikes of around 80 percent or more occurred in 1987, 1999–2000, 2008, and 2010. These price jumps were followed, within a year, by major market drawdowns. This is a risk factor that works both theoretically—higher oil prices hit every area of the economy—and empirically.
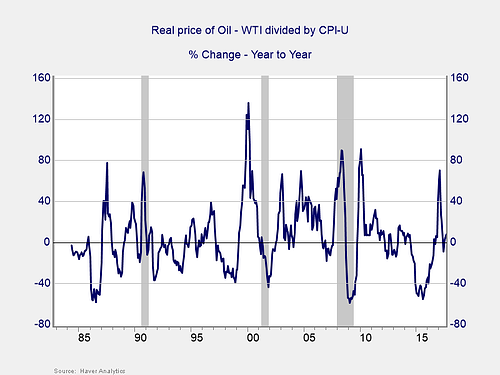
We experienced a recent spike, but time will tell whether this is a risk factor. Right now, I suspect not: it didn’t reach the trouble zone, was short lived, was at much lower absolute levels than past spikes, and has since pulled back. These are positive signs, and I don’t believe this indicator shows immediate risk—but it’s still worth watching.
Interest rates (again). Let’s take one more look at interest rates. We can see from the chart below that when the yield difference dropped below zero, the stock market dropped soon thereafter in both 2000 and 2007. Again, this indicator works both theoretically and empirically.
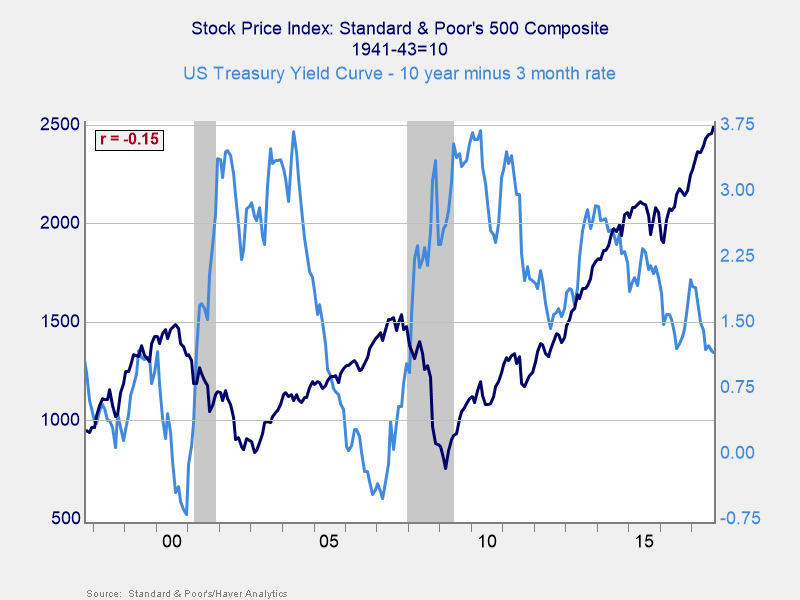
The spread between the 10-year and 3-month rates remains well outside of the risk zone. But the fact that it is now at postcrisis lows suggests that caution is warranted. Although it is not an immediate risk, it could become more of one in the coming months.
Beyond watching the economy and potential shocks, we also need to examine the market itself. Here, two things are important:
- To recognize which factors signal high risk
- To determine when those factors signal that risk has become an immediate concern, rather than a theoretical one
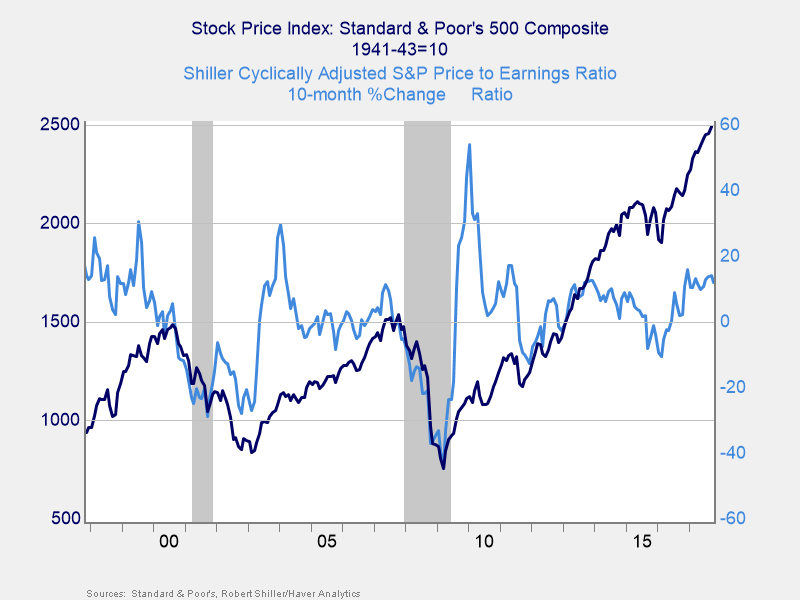
Valuations. When it comes to this key factor, I find the Shiller price-to-earnings (P/E) ratio to be an important risk indicator. It uses current prices and average earnings over the past 10 years to measure stock valuations against a full business cycle. As good as the Shiller P/E ratio is as a risk indicator, though, it’s a terrible timing indicator. To remedy this, we can look at changes in valuation levels over time instead of at absolute levels.
Below, you can see that when valuations roll over, with the change dropping below zero over a 10-month or 200-day period, the market typically drops shortly thereafter. This metric worked in 2000, 2008, 2011, and 2014. Right now, with valuations very high and still rising, risks are high but not immediate.
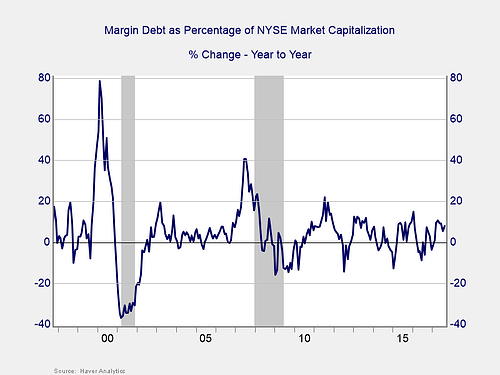
Margin debt. Another indicator of potential trouble is margin debt. It remains close to all-time highs as a percentage of market capitalization. As with valuations, however, debt levels are good risk indicators but bad timing signals. Again, changes in margin debt provide a better immediate risk indicator. So, if we look at the change over time, spikes in debt levels typically precede a drawdown.
As you can see from the next chart, spikes in margin debt of over about 20 percent, year-on-year, occurred in 1984, 1987 (almost), 1994, 1999, 2007, and 2011—all times associated with major market drops. With this indicator, we’re not that far away from the risk zone. Plus, the absolute level of debt adds additional risk, so we need to watch this closely going forward.
Moving averages. Finally, an effective way to track overall market risk is to review the current level against recent performance. Two metrics I follow are the 200- and 400-day moving averages. I start to pay attention when a market breaks through its 200-day average, and I see a break through the 400-day average as a signal of more trouble ahead.
You can see below that both metrics provided good warnings in 2000 and 2007; they also worked in earlier pullbacks. With the exception of sudden drops (like 1987), these are among the most consistent and reliable indicators of trouble ahead. Right now, these indicators remain positive, with the S&P 500 (and the Dow and Nasdaq) well above both trend lines.
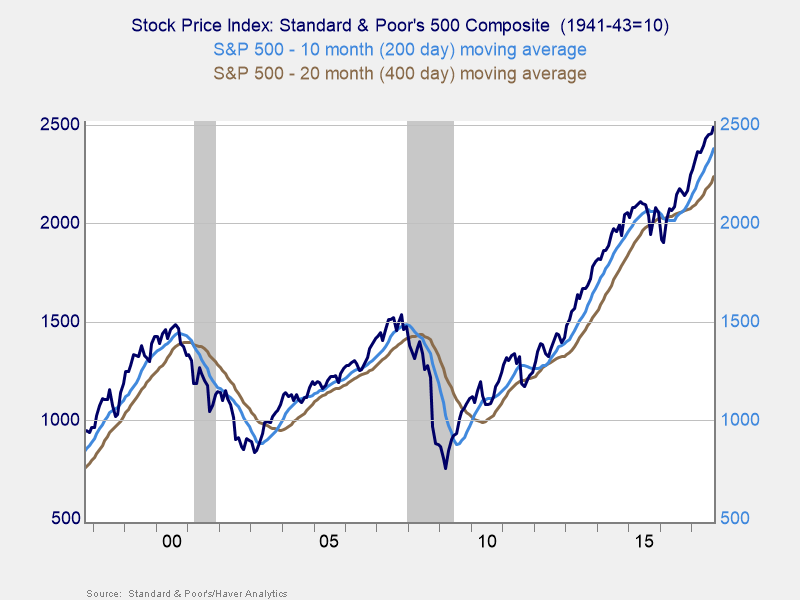
So, what’s the big picture? With both economic and market conditions generally supportive, and with immediate risk levels low—even as absolute risk levels remain high—the stock market will likely keep moving higher.
Given all of these indicators, here’s the ultimate question: how long are these good conditions likely to last? There, unfortunately, the model does not have a great deal to say. Much of the data we are looking at updates monthly, so many signals can be evaluated only on a monthly basis—and may change considerably over that time. Other signals, like the markets and moving averages, change daily. Even there, though, testing shows that these signals are best interpreted on a monthly basis.
I invite you to follow my blog for updates on these conclusions. Check back in regularly to see where we are!
What other market risks are you worried about? Do you think the stock market will keep moving higher? Please share your thoughts with us below!
Certain sections of this commentary contain forward-looking statements that are based on our reasonable expectations, estimates, projections, and assumptions. Forward-looking statements are not guarantees of future performance and involve certain risks and uncertainties, which are difficult to predict. Past performance is not indicative of future results. Diversification does not assure a profit or protect against loss in declining markets. All indices are unmanaged, and investors cannot invest directly in an index. The information contained herein is provided for informational purposes only and is based upon sources believed to be reliable. No guarantee is made as to the completeness or accuracy of the information.
Commonwealth Financial Network is the nation’s largest privately held independent broker/dealer-RIA. This post originally appeared on Commonwealth Independent Advisor, the firm’s corporate blog.
Copyright © Commonwealth Financial Network


