
For this week’s Equity Leaders Weekly, we are going to take a look at the volatile 30-Yr Interest Rate Yield, where the back and forth debate on future US interest rate moves continue. We will also be relooking at the related Long-Term Bond Index through the iShares 20+ Year Treasury Bond ETF (TLT) as its movements inversely mirror interest rate yields with the day to day speculations and commentary on the US Federal Reserve coming into their next meeting in December.
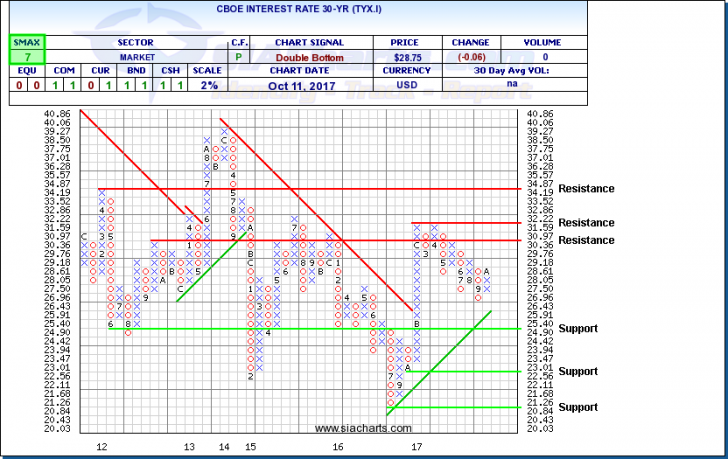
CBOE 30-Year Interest Rate (TYX.I)
We last looked at Treasury yields in April, just three weeks after the United States Federal Reserve increased its benchmark interest rate by 25 basis points to the 0.75%-1.00% target range. They again raised their target in June to 1.00%-1.25% where the measure currently sits right now. U.S. interest rates had continued to rise after the U.S. presidential election back in November of last year, driving down bond prices, until mid-December before consolidating sideways. The aftermath of the election and also the potential policy implications with the new administration was felt not only in the interest rate yields, but also within the relative strength rankings of various duration and credit quality fixed income investments both within the US universe but also on an international scale.
The most recent quarter saw no change to the rhetoric coming from the Federal Reserve, where Fed Chair, Janet Yellen reiterated that they will stick to a gradual approach when raising interest rates, but gave no clear indication of another interest rate hike this year. Chicago Fed President, Charles Evans on Wednesday said that a rate hike at the next Fed meeting in December is not a “done deal”, according to Wall Street Journal as they try to balance interest rates and inflation in the United States. This comment echoed the Fed minutes from last months meeting released yesterday with some people supporting another hike in December while others suggesting that it may take longer to get to the target 2% inflation level and that another increase may be damaging.
As you can see on the chart, the long column of X’s that started in October for the CBOE 30-Yr Interest Rate (TYX.I) had continued since its breakthrough of the long-term down trend line, which had been in place since 2013. The post-Trump win rally continued until the end of 2016 where it began a gradual slide which has continued through all of 2017. With the recent move below 2.75% in September, we now find additional support at 2.49%, 2.3% and 2.08%. Upside resistance is found at 3.10% and 3.22% and higher at 3.49%. TYX.I’s SMAX score has flipped positive again and is sitting at a 7 out of 10 showing near-term strength relative to the asset classes.
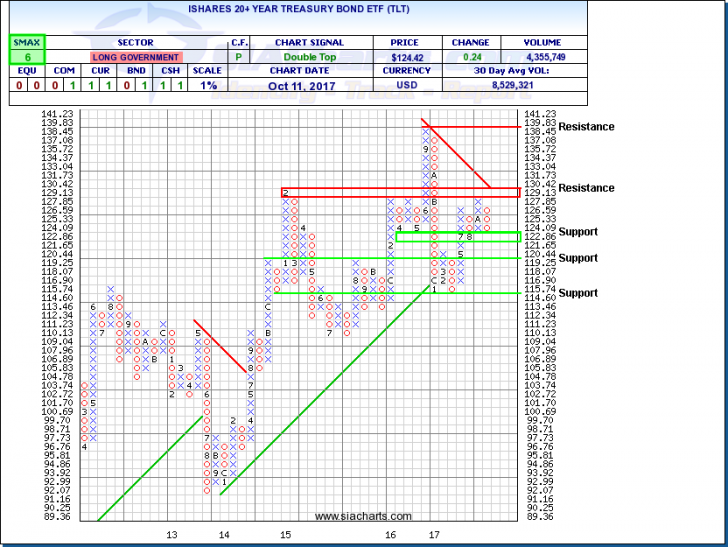
iShares 20+ Year Treasury Bond ETF (TLT)
Next, we will look at the iShares 20+ Year Treasury Bond ETF (TLT). Bond prices move inverse to interest rates, with bonds on the longer end of the duration curve generally being more volatile. Earlier this year TLT hit lows not seen since late 2015 after speculation and then the eventual interest rate increases from the Fed at the end of 2016 and back in Q1 and Q2 of this year. Since July, we have seen a slight reversal in TLT, but there looks to be some strong resistance should this trend continue, especially with the threat of rising interest rates. Prior to the Fed Minutes being released on Wednesday, Wall Street was pricing in a 90% chance of a rate hike during their next meeting in December.
Taking a deeper focus on the TLT chart, we can see the strong resistance in place around the $130 level which has held five out of six times over the last three years and also lines up with resistance potentially coming from the long-term down trend line. Above this level, further resistance comes in at all-time highs around $140. Key support for TLT can be found around the $121-$123 level. Should the $121 level give way, the next level of support would be $119.25 and below this at ~$115.
With an SMAX of 6 out of 10, TLT is holding some near-term strength relative to some broad asset classes.
SIACharts.com specifically represents that it does not give investment advice or advocate the purchase or sale of any security or investment. None of the information contained in this website or document constitutes an offer to sell or the solicitation of an offer to buy any security or other investment or an offer to provide investment services of any kind. Neither SIACharts.com (FundCharts Inc.) nor its third party content providers shall be liable for any errors, inaccuracies or delays in content, or for any actions taken in reliance thereon.
For a more in-depth analysis on the relative strength of the equity markets, fixed income, commodities, currencies, etc. or for more information on SIACharts.com, you can contact our sales and customer support at 1-877-668-1332 or at siateam@siacharts.com.
Copyright © SIACharts.com