
For this week’s edition of the Equity Leaders Weekly, we are going to re-examine the Lumber Continuous Contract (LB.F) since we last commented on this back on the June 22nd edition of the Equity Leaders Weekly. We will also examine how the lumber related stocks, specifically West Fraser Timber, has performed throughout this time period when the current US Administration began implementing a 27% tariff on Canadian softwood lumber back in the spring.
Lumber Continuous Contract (LB.F)
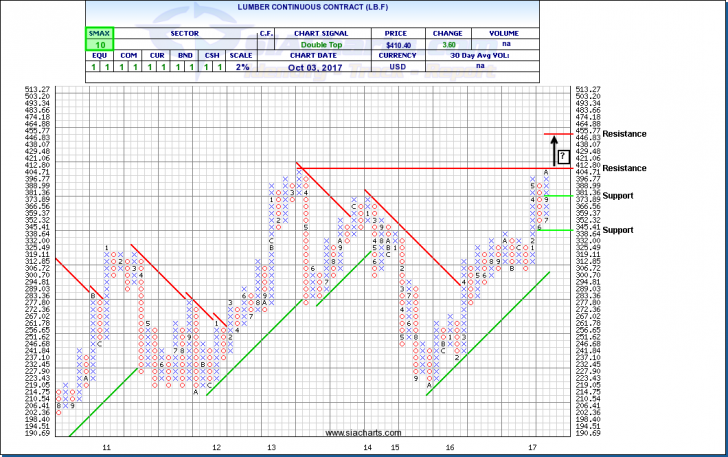
Since we last commented on Lumber in the Equity Leaders Weekly, the commodity had formed a critical 3 box reversal to the upside. Since that time, a lot has transpired on the softwood lumber issue. In late August, the US Department of Commerce announced it will postpone its final decision in its investigations of anti-dumping duties and countervailing duties on softwood lumber from Canada until mid-November. As a result of this announcement, Canadian softwood lumber producers are now getting a temporary reprieve as a large portion of the duties which have been in place since the spring have ended until the final decision is made in November.
Another interesting development which has come to the forefront is that some members within the US political scene has come forth and have lobbied against the implementation of these tariffs on Canadian lumber. Specifically, Maine’s governor, Paul LePage, has publicly said Canadian lumber is needed now more than ever in the US in the wake of Hurricane Harvey and this commodity will be essential in the rebuilding of Texas after the storm. It will be interesting to see what’s in store next for this contentious issue between Canada and the US.
Let’s look at the attached chart of lumber since we last looked at it. As mentioned, back on June 22 we saw that lumber had reversed to the upside with an all-important 3 box reversal and continued this trend through the summer to where it sits today. Lumber is on the verge of breaking out to new multi-year highs testing a critical resistance level at $412.80. If it manages to break above this resistance level it will reach price points not seen in over 10 years prior to the 2008 financial meltdown. The next resistance levels above the ke resistance level of $412.80 can be found the $450.00 area. Support is now at $373.89 and, below that, $338.64. With an SMAX of 10 out of 10, Lumber is showing near term strength against all asset classes.
West Fraser Timber (WFT.TO)
Now let’s examine how the lumber-related stocks have performed during this during this period of uncertainty. Many investors and advisors always consider the fundamentals when analyzing a sector or investment. As such, one would have thought with the implementation of these punishing tariffs that Canadian lumbers stocks would have reacted negatively to the downside. In fact, we have seen transpire is that many lumber stocks have remained quite strong and have continued to make higher highs such West Fraser Timber and Canfor.
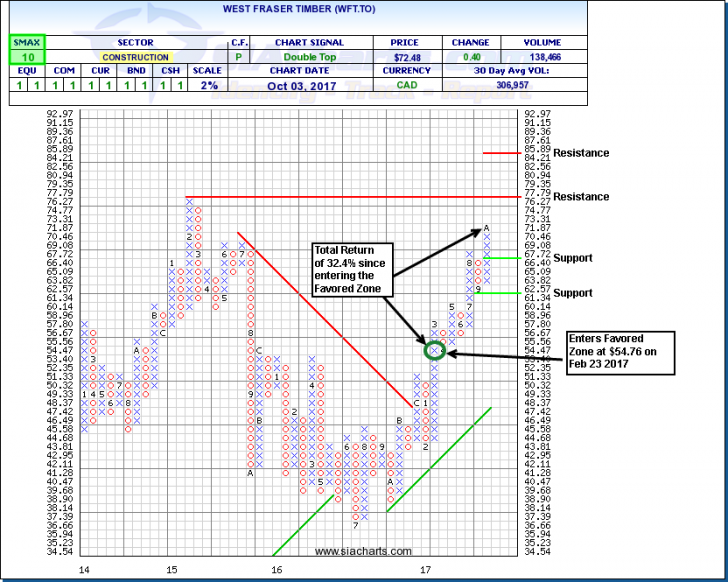
Let’s take a look at the chart of West Fraser as an example. West Fraser Timber can be found in the SIA S&P/TSX Composite Index Report and currently occupies the #5 spot. The stock had entered the favored zone of the report back on Feb 23, 2017 at $54.76. As of Oct 3rd, the price was $72.48. This is a total return of 32.4% in a little over 7 months. Many investors may have exited the position last spring thinking the fundamentals of the industry may have been damaged by the implementation of the increased tariffs. SIA’s Relative Strength analysis aims to follow money flow dynamics and during this time period the relative strength had not detected any money outflows during this time as the shares had remained firmly in the favored zone of the SIA S&P/TSX Composite Index report.
This is an excellent example of a bullish signal that could have been made upon entering the favored zone and using SIA’s Relative Strength analysis to keep you in winning positions while also maintaining a unbiased viewpoint regardless of the perceived fundamental backdrop that may have been associated with the sector.
In looking at the attached chart, support for WFT.TO can be found at $66.40 and, below that, $61.34. Resistance can be found at $77.79. If it manages to break above this resistance level, the stock will have made a new all-time high with the next area of resistance at approximately the $85.00 area. With an SMAX of 10 out of 10, WFT.TO is showing near term strength against all asset classes.
SIACharts.com specifically represents that it does not give investment advice or advocate the purchase or sale of any security or investment. None of the information contained in this website or document constitutes an offer to sell or the solicitation of an offer to buy any security or other investment or an offer to provide investment services of any kind. Neither SIACharts.com (FundCharts Inc.) nor its third party content providers shall be liable for any errors, inaccuracies or delays in content, or for any actions taken in reliance thereon.
For a more in-depth analysis on the relative strength of the equity markets, fixed income, commodities, currencies, etc. or for more information on SIACharts.com, you can contact our sales and customer support at 1-877-668-1332 or at siateam@siacharts.com.
Copyright © SIACharts.com