by Ryan Detrick, LPL Research
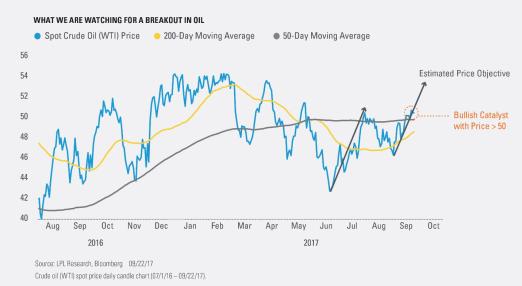
Crude oil (WTI) increased approximately 18.7% off its June 21, 2017 bottom (price as of September 22, 2017) and is now testing resistance at its $50/barrel (bbl.) level. Today we assess a few technical analysis factors that we are monitoring to measure the likelihood of oil continuing to move higher over the next 3–12 months.
Since bottoming on June 21, the price of oil has closed back above both its 50- and 200-day moving averages (DMA), and its daily chart is starting to form what technicians describe as a potentially bullish measured move price pattern*. The measured move is likely to execute into its second leg higher if the spot price (on a closing basis) can remain above its $50/bbl. resistance level for at least five trading days. In this scenario, there is an increased likelihood that oil’s momentum may continue and the price may move higher.
*A measured move chart pattern resembles the form of a lightning bolt and is comprised of three legs; two legs which are at the top and bottom of the lightning bolt tend to be parallel to each other, moving closely in magnitude and direction; and one leg which is in the middle of the bolt tends to move in the opposite direction to the other two. A measured move chart pattern may be helpful in assessing the future price direction of an index or security.
Oil’s recent move back above its 200-DMA, coupled with the fact that the short-term trend (depicted by the 50-DMA) is sloping upward, increases our level of conviction that a measured move chart pattern will execute.
Looking at historical WTI price data going back to 1984, there were 28 instances when the price closed back above its 200-DMA while the 50-DMA was upward sloping. Subsequent price returns tended to be bullish over the next 3–12 months.
Will oil breakout through its key resistance level at $50/ bbl.? There is certainly no guarantee; however, with the recent price closing back above its 200-DMA, there is an increased likelihood that oil’s price continues higher, which may be the catalyst needed to execute the second leg of a measured move and continue its bullish momentum.
*****
Stay tuned to the LPL Research blog for future analysis of oil and other commodities.
IMPORTANT DISCLOSURES
Past performance is no guarantee of future results. All indexes are unmanaged and cannot be invested into directly.
The opinions voiced in this material are for general information only and are not intended to provide or be construed as providing specific investment advice or recommendations for any individual security.
The economic forecasts set forth in the presentation may not develop as predicted.
Investing in stock includes numerous specific risks including: the fluctuation of dividend, loss of principal and potential illiquidity of the investment in a falling market.
Stock investing involves risk including loss of principal.
Technical Analysis is a methodology for evaluating securities based on statistics generated by market activity, such as past prices, volume and momentum, and is not intended to be used as the sole mechanism for trading decisions. Technical analysts do not attempt to measure a security’s intrinsic value, but instead use charts and other tools to identify patterns and trends. Technical analysis carries inherent risk, chief amongst which is that past performance is not indicative of future results. Technical Analysis should be used in conjunction with Fundamental Analysis within the decision making process and shall include but not be limited to the following considerations: investment thesis, suitability, expected time horizon, and operational factors, such as trading costs.
Bloomberg’s spot crude oil price indications use benchmark WTI crude at Cushing, OK; and other U.S. crude oil grades trade on a price spread differential to WTI, Cushing. Prices are on a free-on-board basis. West Texas Intermediate crude oil at Cushing, OK typically trades in pipeline lots of 1,000 to 5,000 barrels a day for delivery between the 25th of one month to the 25th of the next month. These prices are for physical shipments.
This research material has been prepared by LPL Financial LLC.
To the extent you are receiving investment advice from a separately registered independent investment advisor, please note that LPL Financial LLC is not an affiliate of and makes no representation with respect to such entity.
Not FDIC/NCUA Insured | Not Bank/Credit Union Guaranteed | May Lose Value | Not Guaranteed by any Government Agency | Not a Bank/Credit Union Deposit
Securities and Advisory services offered through LPL Financial LLC, a Registered Investment Advisor Member FINRA/SIPC
Tracking #1-647686 (Exp. 09/18)
Copyright © LPL Research


