by Ashwin Alankar, Janus Henderson Investments
High-yield credit markets are a now a better barometer of economic conditions than Treasuries.
There have been plenty of warnings in recent months that a reduction in the amount of extra yield earned by holders of long-maturity Treasuries compared with owners of shorter-dated debt is a signal of an impending economic slowdown. The spreads between two-, five- and 10-year Treasury note yields are well below average. Should short-term rates move higher than longerterm rates, it’s a sure sign of a recession.
Or so the conventional wisdom goes.
The Treasury yield curve has inverted ahead of the past six downturns going back to the 1960s, including prior to the last two recessions in 2000 and 2006. But that was before the era of central bank quantitative easing. Years of unconventional monetary accommodation have led to many market distortions, one of which has been the disappearing term premium, which measures the extra compensation investors need to own long-term bonds instead of continuously rolling over short-term debt. By guaranteeing unprecedented levels of liquidity through its asset purchases, the so-called Fed put has taken risk out of the system and the term premium along with it.
In combination with former Fed Chairman Ben Bernanke’s Operation Twist, under which the central bank bought longer-dated debt and sold bonds of shorter maturities, the policies had exactly the desired effect: 10-year rates plummeted, flattening the curve.
Despite the Fed now moving to unwind liquidity, there may be further flattening pressure in the U.S., or at least a lack of steepening, as ever more accommodative foreign central banks drive yield-hungry overseas investors to U.S. benchmark debt because there is little to no yield available in developed markets outside the U.S.
But this should not be a reason for concern, because all the above distortions mean the shape of the Treasury yield curve is no longer a reliable indicator of an impending recession. A much truer assessment of the threat of a slowdown can be gleaned from the high-yield credit curve, where the impact of central bank policy is much less pronounced.
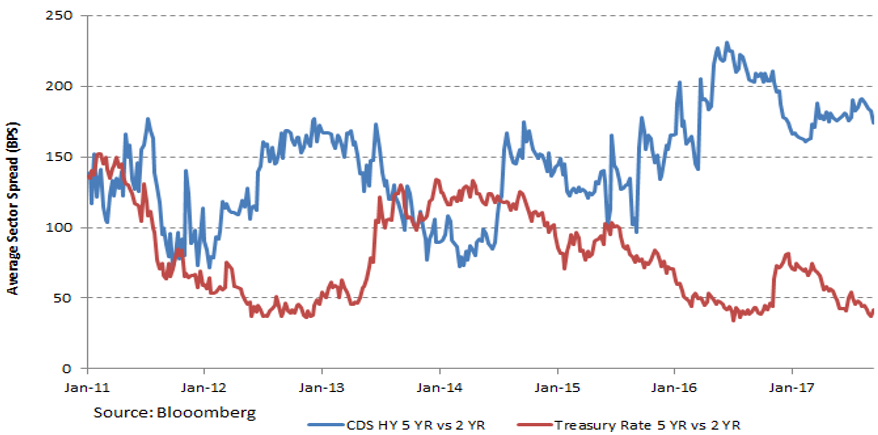
The spread between two- and five-year Treasuries is less than half the average since the end of the global financial crisis, at 41 basis points versus a mean of 90 basis points. By contrast, the extra yield enjoyed by sellers of five-year high-yield credit default swaps versus two-year highyield credit default swaps stands 30 basis points higher than the average.
5 YR vs 2 YR in the Treasury and HY Credit Curves

In other words, yield curves are steep in credit markets and showing no signs of flattening or inverting. On that measure, there’s no hint of a correction.
The imbalances created by global central banks will not disappear overnight, because stimulus measures will only be unwound gradually. For a more accurate barometer of the possibility of recession, credit curves win out over potentially miscalibrated rate curves.
Bloomberg Prophets Professionals offering actionable insights on markets, the economy and monetary policy. Contributors may have a stake in the areas they write about.
First published on Bloomberg View on 09/21/2017
https://www.bloomberg.com/view/articles/2017-09-21/there-s-a-new-yield-curve-to-predict-recessions
Reprinted with permission. The opinions expressed are those of the authors and do not necessarily reflect the views of others in Janus Henderson Investors organization.
Fixed income securities are subject to interest rate, inflation, credit and default risk. As interest rates rise, bond prices usually fall, and vice versa. High-yield bonds, or “junk” bonds, involve a greater risk of default and price volatility. Foreign securities, including sovereign debt, are subject to currency fluctuations, political and economic uncertainty, increased volatility and lower liquidity, all of which are magnified in emerging markets.
Basis Point (bp) equals 1/100 of a percentage point. 1 bp = 0.01%, 100 bps = 1%.
Credit Spread is the difference in yield between securities with similar maturity but different credit quality.
Copyright © Janus Henderson Investments


