


This week in the SIA Equity Leaders Weekly, we are going to revisit and evaluate a few of the pure equity indexes. Starting with a staple, the S&P 500 index (SPX.I), we will look at an index that has continued to exhibit strength, recently hitting new all-time highs, again. Next, we will focus on style diversification and analyze and evaluate two competing style based index ETF’s, the iShares S&P 500 Growth ETF and the iShares S&P 500 Value ETF, to determine which style is contributing to the continuing strength in this extended bull market.
S&P 500 Index (SPX.I)
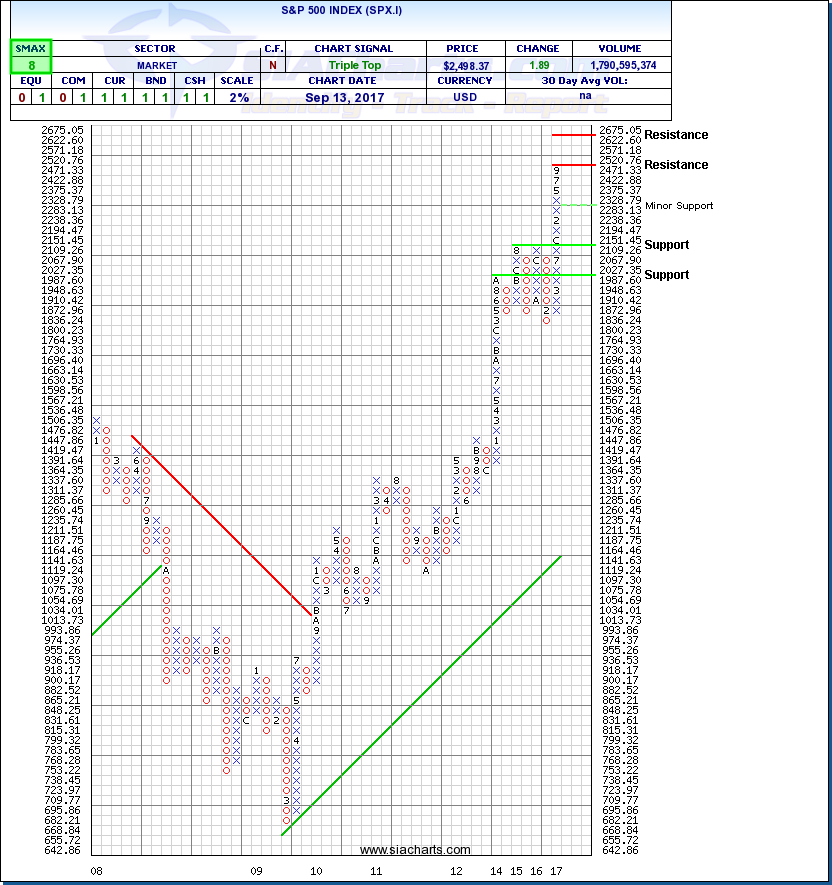
After reaching record highs again this week, the S&P 500 continues to grow in the face of market pundits sure of a material pull back on the horizon. The run we have seen since 2009, lasting 8 and a half years, has now become the third strongest bull market in the history of the S&P 500, sitting most recently behind the 10-year run from 1990 – 2000. Sitting approximately 269% higher over that 8-and-a-half-year period, equating to an approximate annualized gain of about 17% a year, investors have enjoyed some good years. However, this extended bull run in equities is not going unnoticed with the number of investors seeking protection from a possible plunge jumping.
We last examined the SPX.I on March 15, 2017, and have since then climbed from 2,385.26 to 2,498.37, a move of ~5%. Looking at the chart today we can see that SPX.I has moved directly to our previous level of resistance 2,520.76. If the strength continues through this level, watch for resistance to enter again at 2,675.05. Watch for minor support at 2,283.13. From here, if weakness were to set in, watch for support at 2,109.26 and then again 1,987.60. With a current SMAX of 8, SPX.I is currently exhibiting strength across most asset classes.
iShares S&P 500 Growth ETF (IVW) vs. iShares S&P 500 Value ETF (IVE)
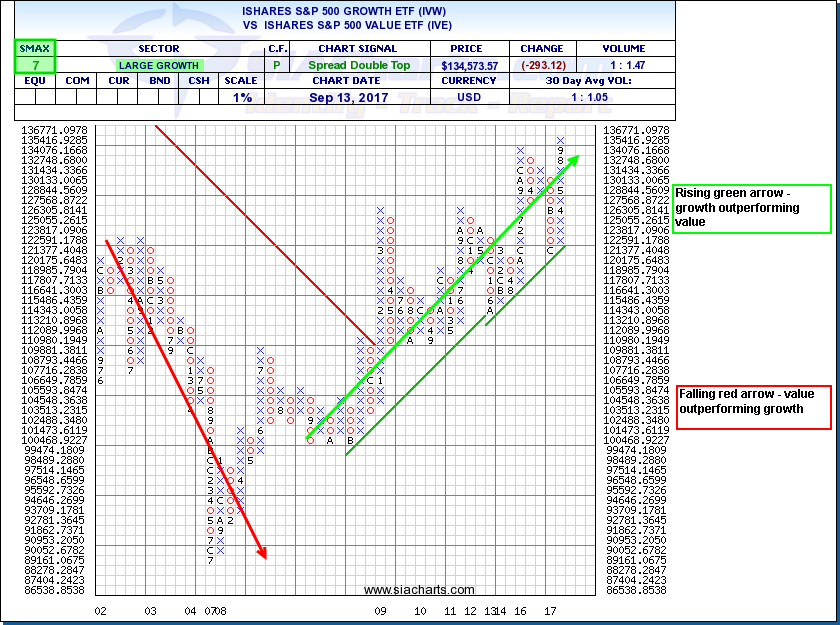
With the market continuing to exhibit strength and show investors new all-time highs, let’s look at and perform an evaluation of two competing style indexes. First, the iShares S&P 500 Growth ETF (IVW), which is made up of U.S. companies whose earnings are expected to grow at an above-average rate relative to the market, has seen a year of outsized returns relative to all benchmarks. Up ~18.85% year-to-date, the IVW has not only participated in the market strength, it has found some legs of its own. Second, the iShares S&P 500 Value ETF (IVE), which is made up of U.S. companies that are potentially undervalued relative to comparable companies, has seen a year of soft or underperforming performance relative to the benchmarks. With a year-to-date return of ~6.32%, value names are not garnering the same attention as their growth counterparts.
As we evaluate the comparison chart between IVW and IVE, the current and rising column of X’s speaks to the outperformance of Growth over Value. Intuitively, a rising and extended bull market would expect to see growth outperform value, with asset prices extended, value names will tend to avoid the positive attention associated with strength in this space. This raises a question about where we are at within this relationship cycle. It is not just the short-term trend of rising X’s that shows growth’s resilience over value, at the same time a long-term trend in growth outperforming value is evident from late 2008 onwards. With the markets making new all-time highs, could we be at a turning point for this comparison relationship? Could an abrupt and possibly sustained market sell off bring attention and interest back to the value space? Only time will tell.
SIACharts.com specifically represents that it does not give investment advice or advocate the purchase or sale of any security or investment. None of the information contained in this website or document constitutes an offer to sell or the solicitation of an offer to buy any security or other investment or an offer to provide investment services of any kind. Neither SIACharts.com (FundCharts Inc.) nor its third party content providers shall be liable for any errors, inaccuracies or delays in content, or for any actions taken in reliance thereon.
For a more in-depth analysis on the relative strength of the equity markets, bonds, commodities, currencies, etc. or for more information on SIACharts.com, you can contact our sales and customer support at 1-877-668-1332 or at siateam@siacharts.com.


