by Jeffrey Saut, Chief Investment Strategist, Raymond James
As many of you know, we have been on holiday in South Africa for the past three weeks. The trip began with a long plane ride to Cape Town where we were gathered up and taken to the five star rated Ellerman House (Ellerman). The place is appropriately named because it is not really a hotel, but rather a home with elegant furnishings, an art gallery populated with African art, a fabulous restaurant and wine bar, and a spa. Quite frankly, it is the home you wish you lived in. From there we drove to the wine country in Stellenbosch and Franschhoek, which actually felt like being in Switzerland. After a few days of wine tours we headed to Jeffreys Bay, one of the best surfing towns in the world, followed by a quick plane ride to Durban and Umhlanga where we stayed another must see hotel named The Oyster Box (Oyster Box). The highlight of the trip, however, was a safari at Zulu Nyala and Phinda (Zulu). To be sure, we saw most of the animals of South Africa and four of the “big five” because regrettably we never saw an African leopard (Big Five). For anyone wanting to go to Africa our advice is . . .GO.
So what’s happened in the various markets in our absence? Well, the answer to that question, from just looking at the averages, is not much. When we left the S&P 500 (SPX/2476.55) was changing hands around 2475 and as of Friday’s closing bell was trading at 2476. Beneath the surface, however, there have been a lot of moving parts. We had the Hurricane Harvey tragedy, more geopolitical situations: North Korea, Chinese “mischief” in the South China Sea, Nigeria, tensions between India and Pakistan, riffs between India and China, Brexit squabbles, potential tariffs on Chinese steel, NAFTA renegotiations, and of course the First Lady’s shoes (as the liberal “Daily Show” host Trevor Noah aptly said, “Here’s the thing, I don’t know why anyone should care what anyone wears when they’re on their way to help people.”).
Speaking to the hurricane horrors, we had one portfolio manager (PM) recite the famous French economist Frederic Bastiat’s (1801 – 1850) quip about the “broken window fallacy.” Said quip goes like this according to Investopedia:
In Bastiat's tale, a man's son breaks a pane of glass, meaning the man will have to pay to replace it. The onlookers consider the situation and decide that the boy has actually done the community a service because his father will have to pay the glazier (window repair man) to replace the broken pane. The glazier will then presumably spend the extra money on something else, jump-starting the local economy.
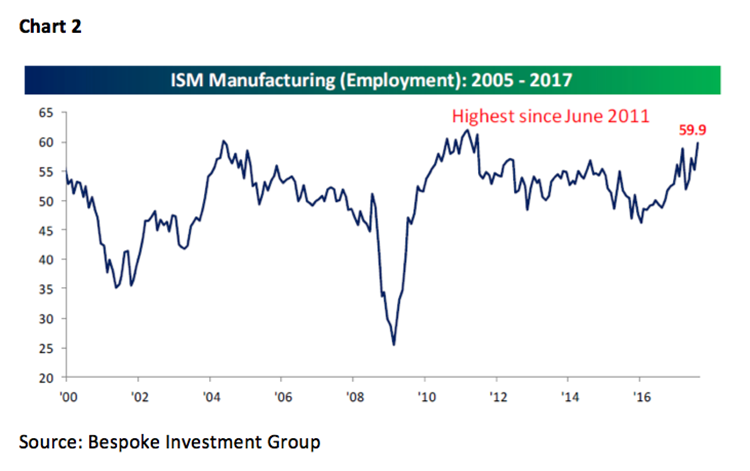
Bastiat goes on to explain why that is not true in the real economy. Likewise, the sagacious Caroline Baum stated in an article on MarketWatch (8-29-17), “No, hurricanes are not good for the economy – Yes, GDP may get a temporary boost from rebuilding, but there is nothing positive about destruction” (read the article here: Baum). That same PM suggested that thousands of trucks are now underwater, and since Texans love their trucks they will replace them, which should be positive for the truck manufactures. One positive thing coming out of this catastrophe is that it is now almost certain the debt ceil gets raised due to the billions of dollars in hurricane aid money that has been attached to the debt ceiling bill. Also on the positive side Chinese export orders tagged their best levels in seven years, British manufacturing hit a four month high, the French manufacturing PMI orders rose at the fastest rate in years, and Greece and Italy are doing better as the world’s synchronized economic recovery continues. Here in our country the recovery is quite noticeable with the ISM Manufacturing Index reaching its highest level since 2011 (Chart 1). The ISM Manufacturing Employment Index confirms that strength with its highest reading since 2011 (Chart 2). Meanwhile, ISM Manufacturing (customers’ inventories) is plumbing lows, also not seen since 2011, implying future demand and further economic strength (Chart 3).
Also in “recovery mode” are earnings as the transition from an interest rate, to an earnings driven secular bull market, continues. As of last week, the S&P had the bottom-up operating earnings estimates for 2017 at $126.95 and at $144.67 for 2018 (as a sidebar, remember that every one point decline in the corporate tax rate hypothetically adds $1.31 to S&P 500 earnings). While those current S&P earnings estimates leave the SPX trading at 19.5x this year’s estimate, and 17.11x next year’s, in past missives we have presented arguments why price-to-earnings multiples (P/Es) should be higher than historic norms. We have also shown that P/E multiples are a pretty poor market-timing tool.
So, when we left for holiday in early August we opined that unlike the short-term trading advice we have used since two of our models flipped positive in mid-April – “to buy the dips” – was not operative this time. Once again, like in late-January, our short/intermediate models were “looking” for a 5 - 10% pullback. And, once again we have not gotten that, at least as of yet. What we did get was the same 2.8% pullback that we saw in the February to March pullback. What did happen in the recent drawdown was a break below the SPX’s “uptrend line” that has been in place since November of last year (Chart 4); and it also took that index below various moving averages. But again, just like in February and March, the SPX gathered itself together and re-rallied. Studying Chart 4 one ponders the question, “Is the SPX in the process of making a double-top in the charts, or is this the beginning of a new leg to the upside?” To answer that question we turn to our models.
To reiterate, our long-term model turned positive in October of 2008 and has never registered a bearish reading since. However, our short and intermediate-term models flipped negative in late-July/early-August, which prompted our trading call of, “We would not buy this envisioned dip.” So far that has proved wrong-footed. Compounding the current state of confusion is the fact that our short-term model went positive two weeks ago, but the intermediate-term model remains negatively configured. In the past, when this has happened, we have found it best to exercise the rarest trait on Wall Street – patience! Andrew Adams has repeatedly written about “patience” in our absence and we agree with him. In the not too distant future the equity markets will “tell” us what the correct strategy will be on a trading basis. Longer-term, we repeat “Old Turkey’s” advice from the book “Reminiscences of a Stock Operator,” “After all, this is a bull market!”
Moving on to the sectors, we have favored select macro sectors since our models called for a rally the week before the presidential election. Those favored sectors have been: Technology, Healthcare, Materials, Consumer Discretionary, Industrials, and Financials. Three of those sectors have outperformed the S&P 500, while three of them have not (Chart 5). Recently we have become very interested in Energy given the “selling exhaustion” readings on many energy stocks. With most of the energy complex trading at/new yearly lows, we think as tax loss selling season arrives portfolios should accumulate favored energy names. Finally, recently we have been hearing that tech is a very expensive sector after it huge rally, but this is just not true (Chart 6).
The call for this week: Gideon John Tucker wrote "No man’s life, liberty or property is safe while the Legislature is in session." Those sage words are just as pertinent today as they were when first scribed in 1866. And, those words should be considered this week as Congress returns to D.C. with an uncertain legislative agenda. Adding to the uncertainty is North Korea’s successful hydrogen bomb explosion over the weekend. Our sense is that if there is going to be a downside feint it should begin this week. Certainly the seasonality is right for that with the D-J Industrials losing ~1.09% in the month of September 41% of the time. Also of note is that the August – November timeframe for years ending with the number “7” have a tendency to be a difficult time for stocks (1977, 1987, 1997, 2007 . . . 2017?). Moreover, the Momentum Indictor is short-term bearish, the Breadth Indicator is neutral, and the Sentiment Indicator is showing extreme complacency. This morning the preopening S&P 500 futures are down only 5.50 points despite renewed tensions on North Korea’s H-bomb success. Typically the day after Labor Day is an “up” session, so traders will likely play for a rally emboldened by the UTX takeover of COL. We continue to exercise patience.


Additional information is available on request. This document may not be reprinted without permission.
Raymond James & Associates may make a market in stocks mentioned in this report and may have managed/co-managed a public/follow-on offering of these shares or otherwise provided investment banking services to companies mentioned in this report in the past three years.
RJ&A or its officers, employees, or affiliates may 1) currently own shares, options, rights or warrants and/or 2) execute transactions in the securities mentioned in this report that may or may not be consistent with this report’s conclusions.
The opinions offered by Mr. Saut should be considered a part of your overall decision-making process. For more information about this report – to discuss how this outlook may affect your personal situation and/or to learn how this insight may be incorporated into your investment strategy – please contact your Raymond James Financial Advisor.
All expressions of opinion reflect the judgment of the Equity Research Department of Raymond James & Associates at this time and are subject to change. Information has been obtained from sources considered reliable, but we do not guarantee that the material presented is accurate or that it provides a complete description of the securities, markets or developments mentioned. Other Raymond James departments may have information that is not available to the Equity Research Department about companies mentioned. We may, from time to time, have a position in the securities mentioned and may execute transactions that may not be consistent with this presentation’s conclusions. We may perform investment banking or other services for, or solicit investment banking business from, any company mentioned. Investments mentioned are subject to availability and market conditions. All yields represent past performance and may not be indicative of future results. Raymond James & Associates, Raymond James Financial Services and Raymond James Ltd. are wholly-owned subsidiaries of Raymond James Financial.
International securities involve additional risks such as currency fluctuations, differing financial accounting standards, and possible political and economic instability. These risks are greater in emerging markets.
Investors should consider the investment objectives, risks, and charges and expenses of mutual funds carefully before investing. The prospectus contains this and other information about mutual funds. The prospectus is available from your financial advisor and should be read carefully before investing.
Copyright © Raymond James