
by Resolve Asset Management Team
S&P 500 valuations are stretched. Exactly how stretched? And what should we infer about future returns?In this 6-minute video Adam Butler introduces a simple but novel innovation for modeling equity market valuations. There are reasons to believe average valuations should rise through time in response to changes in market structure. We discuss the conditions that might lead to higher valuations through time, and present a model to account for it. Viewers might be surprised at what we find when we analyze current valuations through the lens of this new model.
Reminder: Valuations are Useless for Market Timing
Benjamin Graham famously stated that “In the short run the market is a voting machine, but in the long run, it is a weighing machine.” It is critical to keep this in mind as we discuss market valuations. In the short term, prices are set largely via reflexive forces related to informational cascades, herding, and positive feedback dynamics – so-called “animal spirits”. Markets that have gone up recently are more likely to continue going higher, regardless of valuations, as investors are primarily motivated by the fear of missing out on gains, and lagging their peer group. These dynamics manifest in the so-called “momentum” phenomenon, which has been observed since the dawn of markets.
However, high valuations set up a condition of ‘criticality’, such that as valuations become more stretched, even small shocks to the system can trigger a change of state. Think of a pile of sand. When the pile is small, pouring more sand onto the pile simply creates a larger pile. At some point the pile grows tall and narrow. As more sand falls on the peak, it continues to grow, but eventually a large portion of the structure falls off, collapsing the pile. It can’t be known in advance when the structure will break. But we can observe that the structure is becoming more and more fragile.
Current valuations imply that the market is approaching a state of criticality. So long as there are no major shocks, the market can press higher, perhaps substantially so. But the higher stocks go in the short term, the more vulnerable they become to a major event. This event cannot – to our knowledge – be reliably predicted in advance. However, there are methods – that have nothing to do with valuation analysis – that may be useful in identifying a change of state shortly after the fact, and that may be used to limit losses. We cover such techniques elsewhere, as they are beyond the scope of this article.
To our mind, while valuation analysis is not an effective tool for market timing, it is still extremely useful, primarily for estimating future long-term market returns. When you smooth away all the market noise, the more you pay for a dollar of earnings or balance sheet today, the less you should earn on your investment in the future. Valuation analysis can help quantify this relationship, to help capital allocators make sense of all the available investment options.
Herbert Stein is credited with the tautology that “If something cannot go on forever, it will stop.” Other colloquialisms like “No tree can grow to the sky,” express a similar sentiment. The formal name of this effect is “reversion to the mean”, which is simply the principle that most systems have a reasonable average level, around which the system fluctuates with some random error. This is an extremely useful principle because it allows us to identify when a system has strayed too far from its normative value, and quantify a likely trajectory.
Most analysts take the long-term average valuation level for their equilibrium value. This method is parsimonious and defensible, but it makes the assumption that the variables that factor into valuations do not change through time. While this may indeed be the case, for several reasons, we have cause to question this assumption.
Should Valuations Expand Over Time?
Notwithstanding myriad fundamental factors that influence equilibrium market valuations, the fact is that time itself should lead to a higher equilibrium. Consider that, as markets progress through time, they present investors with more data. Investors who take the time to study this data may become more confident about the market’s true character. Participants might feel they have a better grasp of the distribution of risk and expected payoffs, and therefore require a lower return to deploy capital, leading to higher average prices over time.
Other less nebulous factors may also exert an upward bias on valuations. Markets have become much more liquid, and investors will pay a premium for liquidity. They have also become much more transparent. Data is ubiquitous and immediate. The cost of trading has become negligible for larger participants. In addition, innovations like Futures and ETFs tracking diverse global asset classes offer investors many more instruments to trade, which means equities are less risky as a constituent in a diversified portfolio. For these and other reasons, investors require lower returns to compensate them for equity risk, which should drive valuations higher over time.
If equilibrium valuations expand through time, it makes less sense to use the long-term average valuation to measure whether stocks are expensive or cheap. Rather, the valuation model should account for a consistent expansion in valuations, and evaluate markets at each point in time relative to the current equilibrium. It is relatively straightforward to model this steady expansion in valuations by regressing valuations on the time variable. The slope of the resulting regression line will describe the rate at which valuations expand through time.
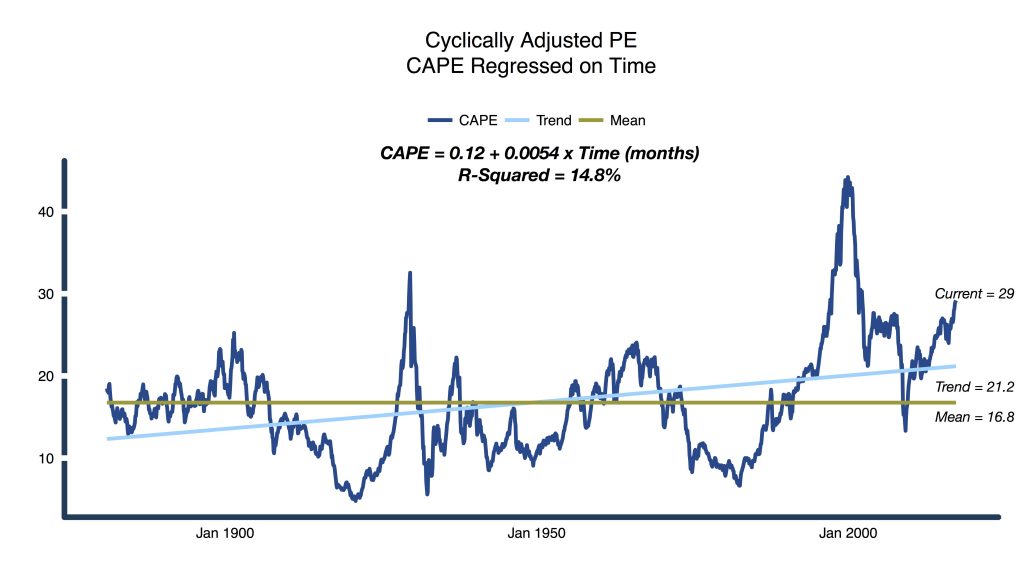
We performed our analysis using the Cyclically Adjusted Price-to-Earnings (CAPE) ratio as our valuation metric. This popular valuation ratio was first proposed by Dr. Bob Shiller, and is often called the Shiller CAPE. It is a compelling valuation ratio because it averages earnings over the horizon of a typical market cycle. As such, it reduces the noise in typical earnings measures that results from margin compression/expansion at different points in the business cycle, as well as the type of earnings write-downs that occur during major bear markets. The ratio also adjusts earnings for the impact of inflation.
Figure 1 illustrates this concept. The dark blue line is the CAPE ratio from 1881 through 2017, while the gold line tracks the long-term mean value of the ratio, at a value of 16.8. The light blue was created by regressing CAPE on the index of months, and tracks the expansion in CAPE over time. You can see that the equilibrium value has expanded from a low of 12 in the late 1800s to 21 today.
Figure 1. Cyclically Adjusted PE Ratio, with Long-Term Mean and Regression on Time
 Source: ReSolve Asset Management. Data from Robert Shiller.
Now that we have equilibrium values for the CAPE ratio through time, we can examine whether the market is expensive or cheap by comparing the current observed CAPE to the current equilibrium CAPE. Given a current CAPE ratio as of April 2017 was 29.2, we note that U.S. stocks are trading about 72% above their long-term average valuation, and 38% above the rising trend.
Some investors may wonder whether current valuations are further explained by prevailing low interest rates. To answer this question, we examined the degree to which adding the current 10-year Treasury interest rate as a variable in our regression improved the explanatory power of our model. To our surprise, current interest rates were almost completely irrelevant in explaining equity market valuations. The explanatory power of our regression model barely budged, moving from 14.8% to 16.1%. Moreover, interest rates were not a statistically significant explanatory variable in the regression.
What are Current Valuations Implying?
If it’s a relief to you that the S&P 500 is only 37% overvalued, remember that this approximates how extended the S&P 500 was in the Global Financial Crisis, the 1960s, and the 1937 Recession, and was only exceeded by valuations during the Tech Bubble, Great Depression and Bank Panic of 1893. But the story is actually even more troubling. That’s because the very same factors described above, which would cause equilibrium valuations to rise through time, would also cause the long-term equity risk premium to decline. In a follow-on article we will examine the decline in U.S. and global Equity Risk Premiums, and use our new equilibrium CAPE model to set expectations for future returns for U.S. stocks.
Now is the time for investors and advisors alike to start thinking about how to reposition portfolios for much lower domestic stock market returns from this point forward, and the potential for a critical event sometime in the next year or two. These headwinds should also motivate investors to start investigating global asset allocation strategies that are designed to row, rather than sail.
Copyright © Resolve Asset Management