
August Preview: Are the Stars Aligned for Volatility?
by Matthew Peterson, Chief Wealth Strategist, Ryan Detrick, Senior Market Strategist, LPL Financial
KEY TAKEAWAYS
• August doesn’t have the same number of big events as recent months, but seasonally it is one of the most volatile months.
• Back-to-school shopping will shed clues as to the health of the U.S. consumer.
• The always anticipated Jackson Hole Symposium ends the month of August and may give hints regarding future Fed and ECB policy.
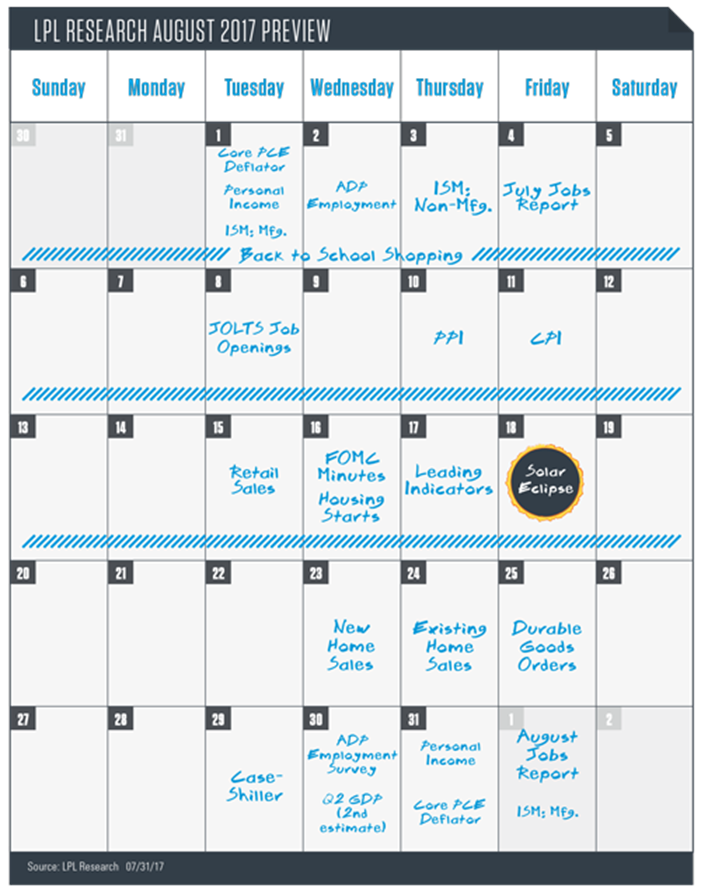
August 2017 begins to close the door on summer here in the United States, but it is also a relatively quiet month in terms of big market moving events. The Federal Reserve (Fed), European Central Bank (ECB), and Bank of Japan all had meetings last month and they won’t hold official monetary policy meetings again until September. Another solid earnings season is winding down as well, which means big news driven events may be slim in August. Even though the month is light on highly anticipated events, this doesn’t mean there can’t be volatility, in fact there normally is. Since the bull market started in 2009, August has been the worst month of the year twice (out of eight years) and has finished in the top half of all months for the year only twice. The biggest event of the month is probably the first solar eclipse to pass the entire continent in 99 years. Which raises the question: are the stars aligned for some volatility? Knowing this month’s history for volatility, it is important to stay on top of the significant happenings coming up. To help, we’ve created this guide to the August 2017 market calendar, providing an overview of the key events.
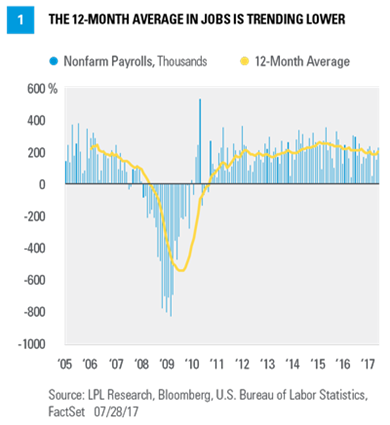
AUGUST 4: July Employment Report
Jobs growth bounced back in June with a very impressive 222,000 jobs created, with both April and May revised higher as well. This is now an incredible record of 81 consecutive months of jobs growth, but as Figure 1 shows, the 12-month average of jobs created continues to trend lower. This is perfectly normal at this stage of the economic cycle and as the labor market continues to tighten, it should eventually push up wages as well. Nonetheless, wage growth was up a disappointing 0.2% last month (month over month), continuing a trend of weaker inflation data. The unemployment rate ticked up to 4.4% last month from 4.3%, but for good reason, as more job seekers came into the market. Strengthening the employment backdrop is the employment index of the Markit Composite Purchasing Managers’ Index (PMI) rising to a seven-month high in July. Lastly, expectations are for 180,000 jobs to be created in August and the unemployment rate to dip back down to 4.3%.
 AUGUST 11 and 31: Inflation Data
With a largely healthy labor market, low inflation has been the main foil of the Fed’s efforts to normalize rates. The Consumer Price Index (CPI) peaked at 2.7% year over year in February, aided by strong year-over-year price gains for oil, and has since declined to 1.6%. The Personal Consumption Expenditure (PCE) Price Index, the Fed’s preferred measure of inflation, peaked at 2.1% year over year in February, its first foray above 2% since 2012, and has since fallen to 1.4%. Current core readings (excluding food and energy) are similar. The Fed had initially emphasized the role of “transitory factors” in declines from February peaks, highlighting idiosyncratic price changes for wireless telephone services and prescription drugs. These factors aren’t enough to account for declines alone, but they play some role and will continue to have an impact until they roll off the year-over-year number in 2018. In its July 26 policy statement released at the conclusion of its most recent two-day meeting, Fed policymakers made small accommodations to declines in inflation compared to the June statement, changing its declaration that inflation had “recently declined” and is “running somewhat below 2%” to inflation has “declined” and “is running below 2%.” Granted these are small adjustments, but small adjustments in the statement are one of the ways the Fed signals its intentions to markets. July CPI data will be released on August 11, with current consensus expectations at a 0.1% month-over-month increase, 0.2% ex-food and energy. The July PCE Price Index will be released on August 31.
FIRST THREE WEEKS OF AUGUST: Back-To-School Shopping
Back-to-school (BTS) shopping is already underway and we expect a very strong season, but anticipate things really heating up in August. The National Retail Federation (NRF) is forecasting a more than 10% increase in BTS sales this year versus 2016. We see several reasons to be optimistic:
- Consumer confidence is high. Based on the University of Michigan consumer sentiment readings, consumers haven’t been this confident in over a decade.
- Steady job gains. A solid job market is driving the confidence and providing fuel for spending. Annual wage gains of 2–2.5% are hardly eye-opening but they are driving more spending.
- Wealth effect. The strong stock market supports spending—the S&P 500 Index is up over 7% over the past six months so shoppers feel wealthier. The strong housing market makes shoppers feel wealthier, with average prices up 5–6% nationally according to various sources (National Association of Realtors, FHFA, S&P CoreLogic Case-Shiller). And, low gas prices don’t hurt as summer driving season continues.
- Online shopping boom. Online players will continue to get an increasing share of BTS shopping, meaning that discounting will again be heavy and the strong sales growth may not necessarily show up in the stock prices of traditional brick-and-mortar retailers. Regardless, the powerful growth in online shopping will be a big part of the annual increase.
- More college kids. According to Prosper Insights & Analytics, the average family spend will be up 6.3%, with the additional sales growth coming from more students, particularly college students.
AUGUST 21: The Great American Eclipse
This one doesn’t have anything to do with markets or the economy, but it is worth getting ready for. If you are lucky enough to be in the 70-mile-wide area to see the total solar eclipse, then you will witness the first total solar eclipse in 99 years that will cast its shadow across the entire continent, in what is called a “path of totality.” It is also the first eclipse since 1776 whose path falls only in the U.S.–which is why it has been dubbed “The Great American Eclipse.”
AUGUST 24–26: Jackson Hole Monetary Policy Symposium
The Kansas City Fed’s Jackson Hole Monetary Policy Symposium takes place from August 24–26, 2017, and the theme this year is “Fostering a Dynamic Global Economy.” This gathering of central bankers has taken place annually since 1978, and tends to be closely watched by markets. Global central banks have at times used this conference to signal upcoming changes to policy. For example, the Fed signaled the start of two quantitative easing (QE) programs in 2010 and 2012, and ECB President Mario Draghi signaled the ECB’s QE program in 2014. This year we are less likely to see central banks signaling stimulus, but markets will instead be watching for signs of tighter policy. The Fed has announced how their balance sheet normalization plan will work, but has so far refused to specify a start date, so markets will be watching Fed speakers closely for any hints. Markets have also been closely watching the ECB in recent months for any comments regarding further tapering of their current QE program. ECB President Draghi will be in attendance, and given that the conference will take place just two weeks before the ECB’s September 7 meeting, investors will be keeping a close eye on his remarks at Jackson Hole.
CONCLUSION
August might not have many high-profile events to look forward to, but history still says this is one month to watch closely as it can be quite volatile. From jobs growth, to inflation data, to BTS shopping, to the Jackson Hole Symposium–there will be plenty for market participants and the Fed to analyze as we head into September. Enjoy those remaining summer vacations. And here’s to hoping your kids adjust quickly to getting up early again!
IMPORTANT DISCLOSURES
The opinions voiced in this material are for general information only and are not intended to provide specific advice or recommendations for any individual. To determine which investment(s) may be appropriate for you, consult your financial advisor prior to investing. All performance referenced is historical and is no guarantee of future results.
Any economic forecasts set forth in the presentation may not develop as predicted and there can be no guarantee that strategies promoted will be successful.
International investing involves special risks such as currency fluctuation and political instability and may not be suitable for all investors. These risks are often heightened for investments in emerging markets.
Investing in stock includes numerous specific risks including: the fluctuation of dividend, loss of principal and potential illiquidity of the investment in a falling market.
Because of its narrow focus, sector investing will be subject to greater volatility than investing more broadly across many sectors and companies.
Purchasing Managers’ Indexes are economic indicators derived from monthly surveys of private sector companies, and are intended to show the economic health of the manufacturing sector. A PMI of more than 50 indicates expansion in the manufacturing sector, a reading below 50 indicates contraction, and a reading of 50 indicates no change. The two principal producers of PMIs are Markit Group, which conducts PMIs for over 30 countries worldwide, and the Institute for Supply Management (ISM), which conducts PMIs for the US.
Personal Consumption Expenditures (PCE) is a measure of price changes in consumer goods and services, targeted towards goods and services consumed by individuals. PCE is released monthly by the Bureau of Economic Analysis (BEA).
The Consumer Sentiment report refers to a report published by the University of Michigan, in which the University’s Consumer Survey Center questions 500 households each month on their financial conditions and attitudes about the economy. Consumer sentiment is important because it is directly related to the strength of consumer spending. Preliminary estimates for a month are released at mid-month. Final estimates for a month are released near the end of the month.
Quantitative Easing (QE) refers to the Federal Reserve’s (Fed) current and/or past programs whereby the Fed purchases a set amount of Treasury and/or Mortgage-Backed securities each month from banks. This inserts more money in the economy (known as easing), which is intended to encourage economic growth.
The Consumer Price Index (CPI) is a measure of the average change over time in the prices paid by urban consumers for a market basket of consumer goods and services.
Copyright © LPL Financial