
by Lance Roberts, Clarity Financial
In a recent post by Jeffrey Snider he made an important observation:
“In August last year, Dr. Krugman proved how little he has learned since March 2008 in chastising others for lack of growth. Writing as usual in the New York Times on what he called the Folly of Prudence, he said, ‘We’ve been living with low-rate, depression economics for 8 years now — and key players are still acting as if they’ve learned nothing.’
Yep. He thinks ‘austerity’ is holding everything back, when in truth it’s all the stuff he didn’t recognize a decade ago and still doesn’t now.
In very general terms, the monetary system continues on unable to meet the modest demands placed on it by even the most modest of growth trends (forgetting recovery from the immense contraction). It, combined with other hidden monetary elements, qualifies in every way for Milton Friedman’s interest rate fallacy. The consistency of T-bills, bond rates, ‘secular stagnation’, etc., is breathtaking in that despite all that the world economy still lost a decade anyway and remains facing the very real prospects for another one. “
While Jeffrey is focusing on the importance of interest rates as they pertain to economic growth, something I have discussed more than once, there is also the issue of another “lost decade” ahead for investors as well due to this idea of “secular stagnation.”
Research Affiliates has also discussed the importance of “secular stagnation” and a coming decade of low returns.
“With slow GDP growth propagating negative or near-zero real interest rates, our message is that expected returns across most asset classes should be lower than their long-term averages. We currently expect about 0.7% average annual real returns over the next decade for both core U.S. bonds and core U.S. equities.”
That doesn’t sound good.
“But Lance, the markets have returned 10% on average over the last century, so RA is probably going to be wrong.”
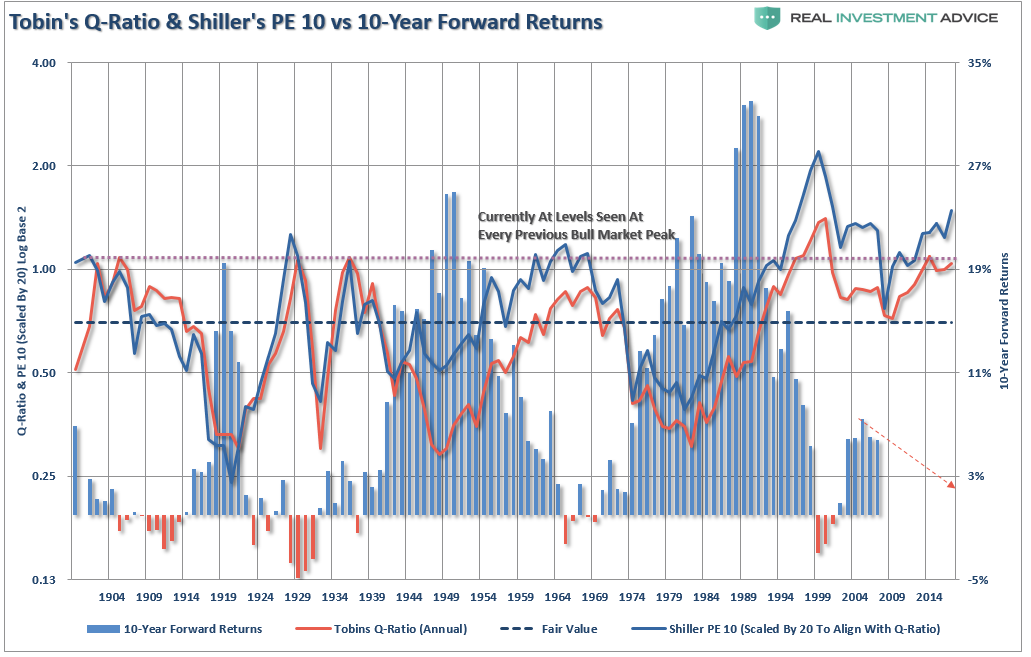
Before you dismiss RA’s comments, it is important to put them into some context. When low rates of return are discussed, it is not meant that each year will be low but that the return for the entire period will be low. The chart below shows 10-year rolling REAL, inflation-adjusted, returns in the markets.
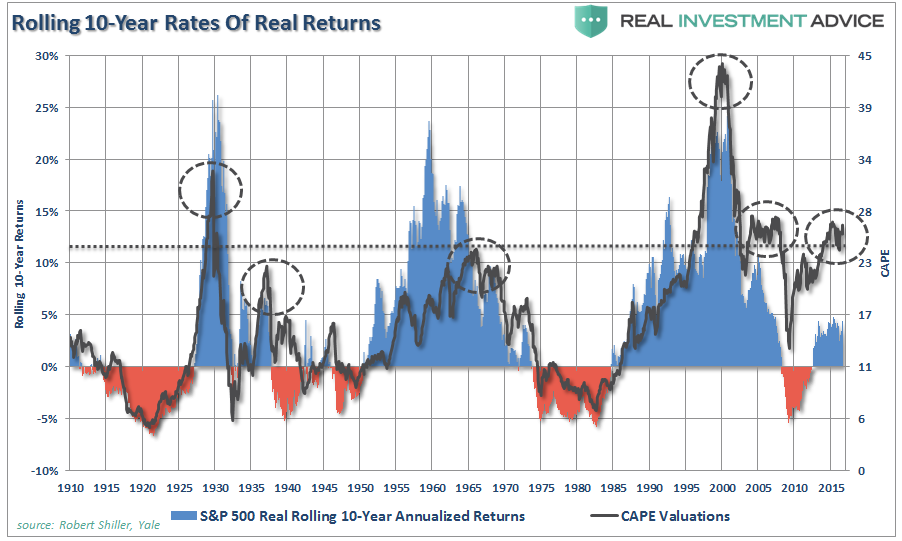
(Important note: Many advisors/analysts often pen that the market has never had a 10 or 20-year negative return. That is only on a nominal basis and should be disregarded as inflation must be included in the debate.)
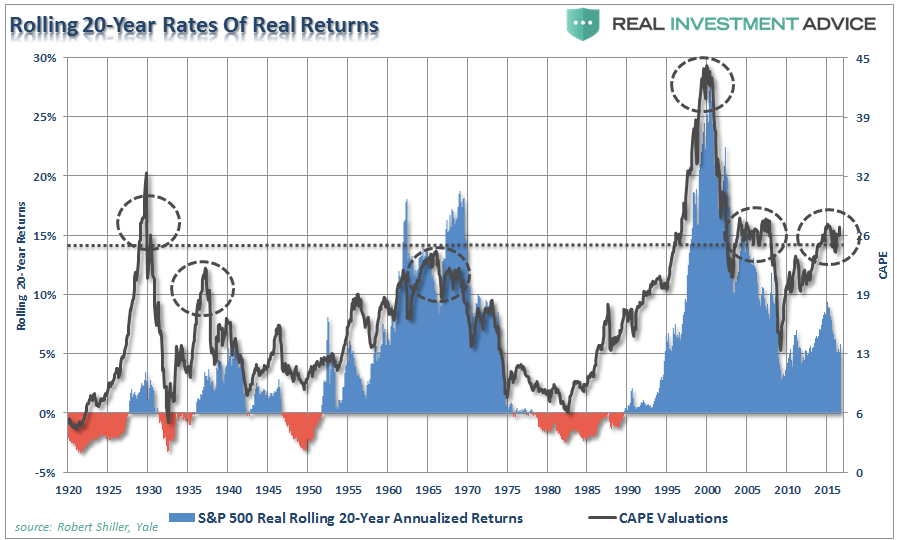
There are two important points to take away from the data. First, is that there are several periods throughout history where market returns were not only low, but negative. Secondly, the periods of low returns follow periods of excessive market valuations. “This time is not different.”
There are two main drivers behind the concept of a “decade of low returns” – secular stagnation and valuations.
Secular Stagnation
While I have written many times in the past about the importance of secular stagnation, RA put a much finer point on the argument.
“Equally insidious is secular stagnation’s feeling of permanence; the trends at fault are slow moving and likely to persist well past the standard business-cycle horizon.
Deleveraging from our debt overhang will take decades. The impact of aging demographics across the developed world is only just beginning to slow both labor force growth and productivity, and this trend will only strengthen in the coming years.
Likely, we have entered a period of secular stagnation heavily impacted by lingering debt overhangs, persistent demographic shifts in savings preferences, and increased efficiency of capital…these longer-run trends, which are powerful and long lasting, and will impact our economic outlook for many years to come. Current deeply negative interest rates will likely shift back toward zero, but within our investment horizon are unlikely to return anywhere close to the historical averages. As Michael Corleone discovered, it is not easy to escape genetic or demographic destiny.”
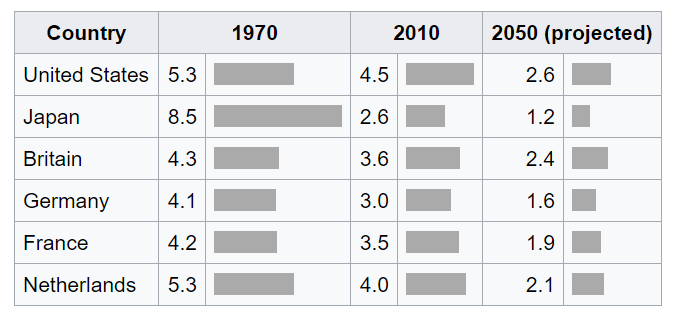
The decline of demographics was clearly shown in “The Unavoidable Pension Crisis:”
“In 1950, there were 7.2 people aged 20–64 for every person of 65 or over in the OECD countries. By 1980, the support ratio dropped to 5.1 and by 2010 it was 4.1. It is projected to reach just 2.1 by 2050. The table below shows support ratios for selected countries in 1970, 2010, and projected for 2050:”
Despite optimistic views that Central Bank interventions can stimulate economic growth and inflation through monetary policies, the reality has been quite the opposite given the massive levels of global debt.
For the markets to generate a higher level of return in the future would require substantially higher levels of real growth. This is unlikely given the aging demographic trends, productivity increases which weigh on employment and wage growth, and debt servicing that diverts dollars from productive investments. This is not just a domestic issue, but a global one.
It is interesting that even though Central Banks acknowledge that it was the ramp up in debt and leverage that led to our current economic problems, it is somehow believed that it can be resolved by simply shuffling debt from governments to central banks. Eventually, the global debt levels will have to be dealt with. Until then, economic growth, inflationary pressures, and interest rates will remain at historically low levels.
Valuation
As investors, we are supposed to be investing for the “long term.” Therefore, we should be viewing valuations as a predictor of returns over the next 10, 15 or 20 years which is the typical investment/savings time frames for individuals. David Leonhardt penned a similar view:
“The classic 1934 textbook ‘Security Analysis’ – by Benjamin Graham, a mentor to Warren Buffett, and David Dodd – urged investors to compare stock prices to earnings over ‘not less than five years, preferably seven or ten years.’ Ten years is enough time for the economy to go in and out of recession. It’s enough time for faddish theories about new paradigms to come and go.”
The chart below shows the long-term history of Shiller’s Cyclically Adjusted P/E Ratio versus forward 2-year total returns.
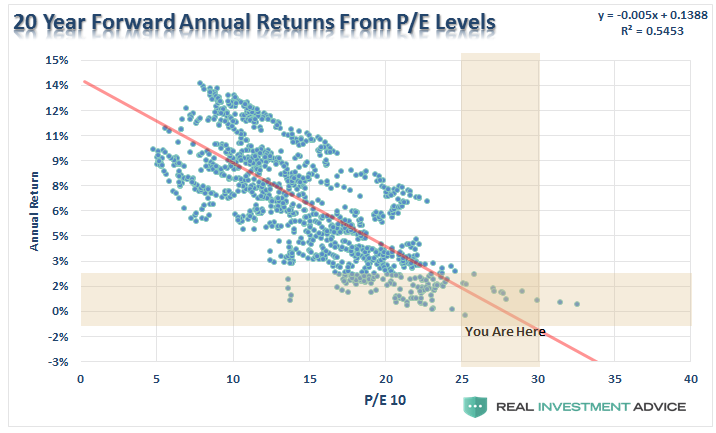
History shows that valuations above 25x earnings have tended to denote secular bull market peaks. Conversely, valuations at 10x earnings, or less, have tended to denote secular bull market starting points.
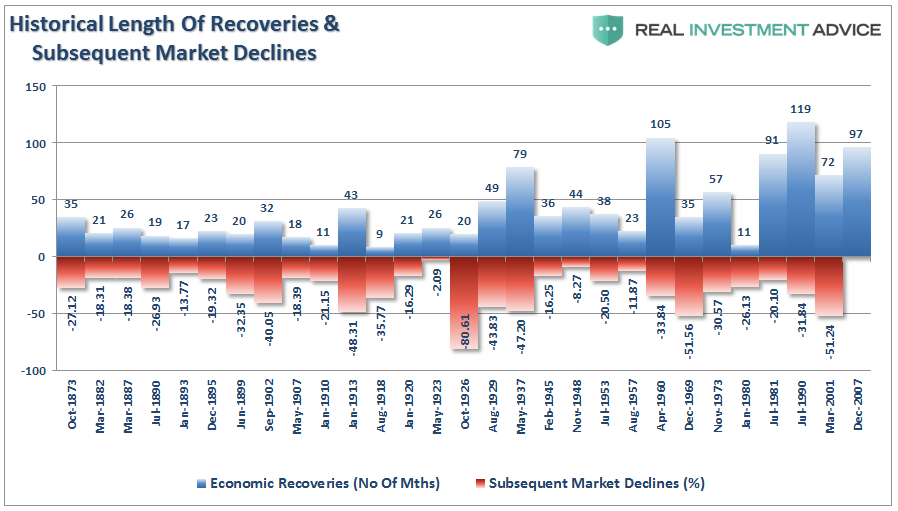
Furthermore, considering the U.S. is now in the 3rd longest economic expansion in history, with the lowest average annual growth rate, one should honestly question the ongoing “bull market” thesis.
As I discussed just recently, when using just about any metric currently, the outlook for investment returns is dismally low.
We can also prove this mathematically as well as shown.
Capital gains from markets are primarily a function of market capitalization, nominal economic growth plus the dividend yield. Using the “Hussman Formula” we can mathematically calculate returns over the next 10-year period as follows:
(1+nominal GDP growth)*(normal market cap to GDP ratio / actual market cap to GDP ratio)^(1/10)-1
Therefore, IF we assume that GDP could maintain 4% annualized growth in the future, with no recessions, AND IF current market cap/GDP stays flat at 1.25, AND IF the current dividend yield of roughly 2% remains, we get forward returns of:
(1.04)*(.8/1.25)^(1/10)-1+.02 = 1.5%
But there’s a “whole lotta ifs” in that assumption.
More importantly, if we assume that inflation remains stagnant at 2%, as the Fed hopes, this would mean a real rate of return of -0.5%.
This is certainly not what investors are hoping for.
Conclusion
Markets are not cheap by any measure. If earnings growth continues to wane, or interest rates rise, the bull market thesis will collapse as “expectations” collide with “reality.” This is not a dire prediction of doom and gloom, nor is it a “bearish” forecast.
It is just a function of how markets work over time.
For investors, understanding potential returns from any given valuation point is crucial when considering putting their “savings” at risk. Risk is an important concept as it is a function of “loss”. The more risk that is taken within a portfolio, the greater the destruction of capital will be when reversions occur.
This time is “not different.” The only difference will be what triggers the next valuation reversion when it occurs. If the last two bear markets haven’t taught you this by now, I am not sure what will. Maybe three times really is a “charm.”
Copyright © Clarity Financial