
For this week’s edition of the Equity Leaders Weekly, we are going to update a couple of charts which were highly influenced in the aftermath of the US election. South of the US border, the Mexican Peso vs the US Dollar saw a lot of weakness just prior to and then immediately after the Donald Trump victory; we will have a look at what's been happening lately. Up north after the Trump administration announced their intention to levy a 20% tariff against Canadian soft wood lumber imports, we immediately witnessed weakness in the Canadian dollar and a subsequent slide in the prices for lumber; today we will look at the recent price activity of the Lumber Continuous Contract (LB.F).
Mexican Peso/US Dollar (MXNUSD)
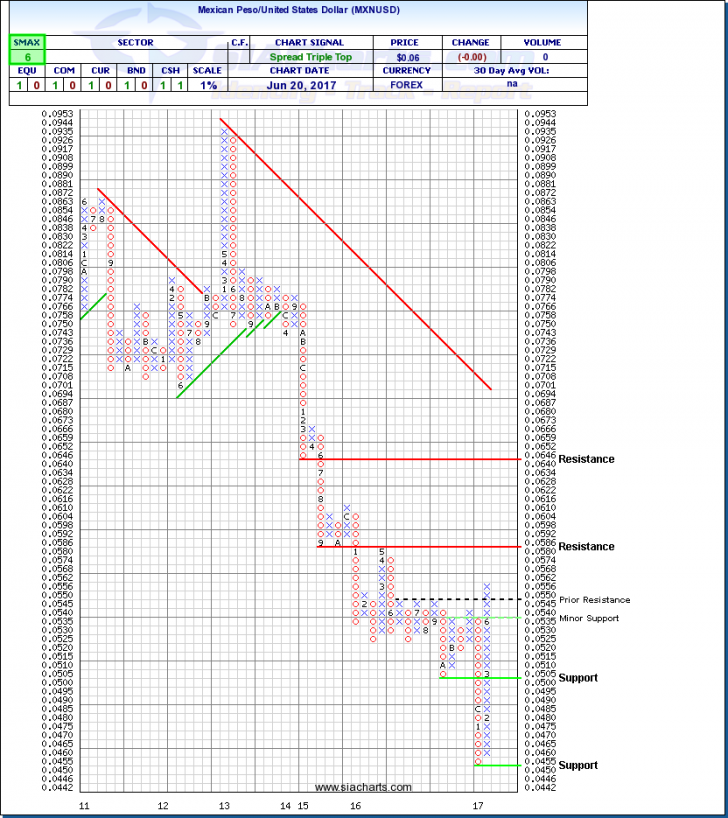
Since last looking at the MXNUSD chart in early February, the historical low witnessed on January 19 was indeed the start of a rather sizable rebound of over 22%, this after the slow and steady decline of over 50% since 2013. Many had seen the slide in the Mexican Peso just ahead of the US election results as a foreshadowing of things to come, but looking at the chart you can see that the currency was continuing its long-term negative trend which had been in place for more than a decade. Reversals, or bottoming formations sometimes come at the most awkward and unexpected times; the day before the inauguration of President Trump the currency began the start of a massive rebound, and as we has mentioned back in February, the Mexican peso has definitely presented itself as one of the more interesting currencies to watch in 2017.
Looking at the updated chart, we can see the MXNUSD bounced off of all time lows in February at around $0.0450 and has since then been in a column of X’s breaking resistance at the $0.0500 level and then successfully through the $0.0550 mark. If strength continues, the next major resistance is seen at $0.0586, and then much higher at $0.0646. To the downside, minor support is found at $0.0535 but the crucial support level is at $0.0500 and then lower at historical lows at $0.0450. With the SMAX moving from 1 out of 10, to the current 6, MXNUSD is now showing short term relative strength versus most of the asset classes.
It will be interesting to see how much higher this currency pair continues to run into the second half of 2017.
Lumber Continuous Contract (LB.F)
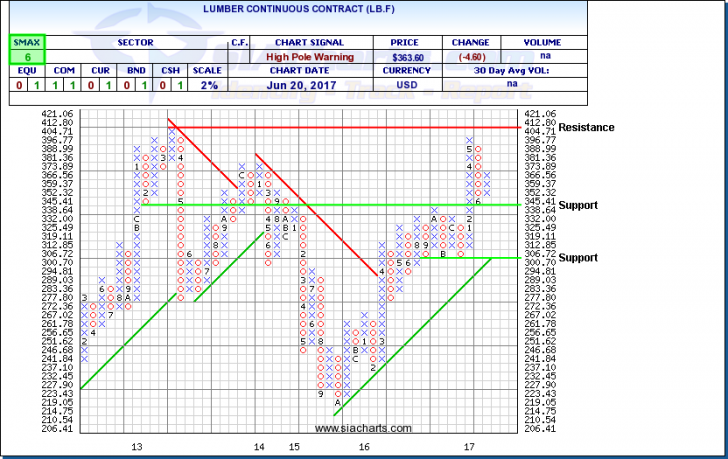
When we last looked at the Lumber Continuous Contract back on April 27, 2017, we commented on the recent announcement by President Trump and his administration regarding their intention to levy a 20% tariff against soft wood lumber imports. The immediate result was Canadian Dollar and of course Lumber price weakness; this weakness in Lumber prices continued until early June but in the past few weeks the prices are seeing a bit of a bounce.
An interesting side story was that certain Canadian lumber companies actually traded to the upside on this announcement since many market participants saw the silver lining as the tariff could have been much higher. Companies such as Canfor and West Fraser benefited during that week, but have also seen continued strength since then.
Looking at the chart, LB.F had pulled back over 18% since its April highs but seems to have found at least a temporary bottom after bouncing off $340 in early June. The 3-box reversal witnessed by the new column of X's has a long way to go before testing major resistance at its 2013 highs of $412.80 but we will wait and see if the announced tariffs have lasting effects. To the downside, in the case that we are just seeing a dead cat bounce, support levels are seen at $345, and then lower at $300. With a current positive SMAX of 6, LB.F is still exhibiting near-term strength across the asset classes.
SIACharts.com specifically represents that it does not give investment advice or advocate the purchase or sale of any security or investment. None of the information contained in this website or document constitutes an offer to sell or the solicitation of an offer to buy any security or other investment or an offer to provide investment services of any kind. Neither SIACharts.com (FundCharts Inc.) nor its third party content providers shall be liable for any errors, inaccuracies or delays in content, or for any actions taken in reliance thereon.
For a more in-depth analysis on the relative strength of the equity markets, bonds, commodities, currencies, etc. or for more information on SIACharts.com, you can contact our sales and customer support at 1-877-668-1332 or at siateam@siacharts.com.
Copyright ©