
by Kevin Horan, Director, Fixed Income Indices, S&P Dow Jones Indices
Canada’s economy has been accelerating due to increased consumer spending and a rebound in business investment. Consumer spending driven by vehicle purchases and real estate investment has lifted the economy, along with improved business investment. The economy and its growth trend now appear to be on a more secure path. As of May 31, 2017, the S&P/TSX Composite returned 1.50% YTD on a total return basis.
Such growth should eventually lead to an increase in overall prices, which to date has not occurred. The CPI, as measured by Statistics Canada, was valued at 1.6% for April 2017. In the near future, more eyes will be on the CPI and the S&P Canada Sovereign Inflation-Linked Bond Index, which returned 1.96% YTD as of May 31, 2017.
Given such an outlook, the Bank of Canada might be moving closer to an interest rate hike. As of May 31, 2017, the yield of the S&P Current 2-Year Canada Sovereign Bond Index was just 0.7%, compared with the U.S. two-year Treasury Bond yield of 1.28%, as the U.S. Fed contemplated an additional rate hike as soon as June 2017.
The Canadian dollar, also endearingly known as the “loonie” after the bird on the currency, has been and continues to be weak against the U.S. dollar. Canada’s many lakeside resorts and destinations should be a bargain to many vacationing U.S. residents this summer.
Exhibit 1: Canadian to U.S. Dollar Exchange Rate
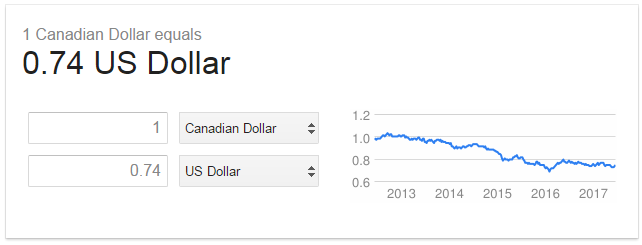
Source: Google; SIX Financial Information. Chart is provided for illustrative purposes.
The S&P Canada Investment Grade Corporate Bond Index has had consistently positive returns each month this year. As of May 31, 2017, the index returned 3.19% YTD. The sectors of the Canadian bond market vary, with financials (59.1%) and energy (10.4%) dominating in terms of market value weight, though their returns for the month, at 0.15% and 0.21%, respectively, lagged behind the leading sectors of health care, at 1.95%, and industrials, at 1.38%.
Exhibit 2: Index Weights and Performance
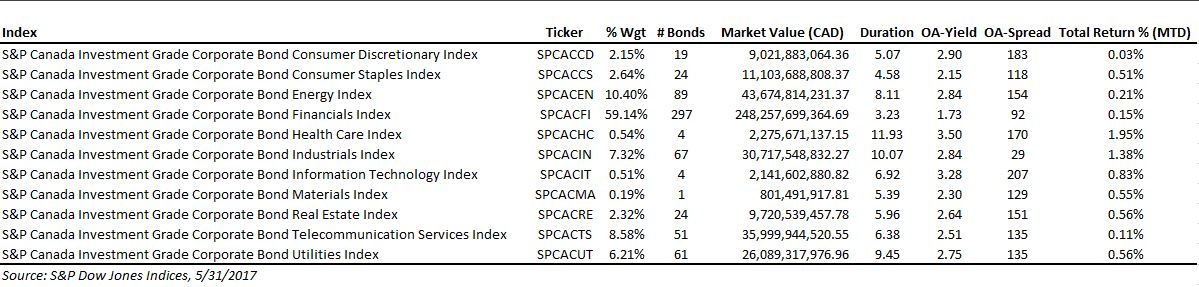
Source: S&P Dow Jones Indices LLC. Data as of May 31, 2017. Past performance is no guarantee of future results. Table is provided for illustrative purposes.