by Ryan Detrick, LPL Research
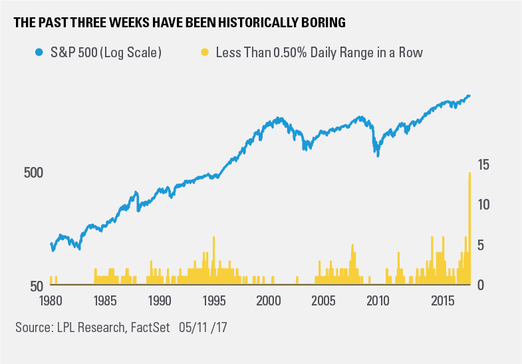
Equity volatility has been extremely low in 2017, much to the surprise of most market participants. From geopolitics, to falling commodity prices, to drama out of Washington – there has been no shortage of potential catalysts. Although yesterday’s 0.59% daily range might not have felt much different from most trading days this year, it ended a record streak of 14 consecutive days with a daily range of less than 0.50%. The previous record was six days, hit four other times (using reliable intraday data back to 1970).
Looking at the four times the S&P 500 Index went six days in a row within a 0.50% daily range, it is important to note this lack of volatility usually happened amid bullish trends. Three months after the previous four streaks ended the S&P 500 was up 1.8% on average, and six months later its average gain was 3.3%.
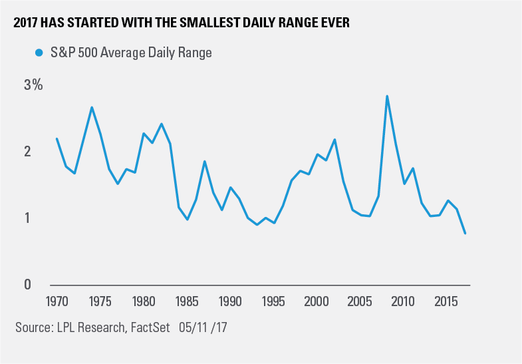
The average daily range for the S&P 500 Index so far this year is 0.57%, which is the lowest range going back to 1970. Additionally, the CBOE Volatility Index (VIX) recently closed below 10; its lowest closing level since 1993 and it has averaged 11.9 so far this year, again the lowest level ever. Per Ryan Detrick, Senior Market Strategist, “Here’s the catch though; volatility won’t stay low forever. Like most things in the market it ebbs and flows. All of this suggests a likely pickup in volatility over the remainder of this year.”
Could volatility stay low through year-end? Anything is possible, but as the economic cycle ages, we expect volatility to likely increase. With earnings and the economy both on firm footing, we would recommend using any weakness to add to portfolios.
IMPORTANT DISCLOSURES
The economic forecasts set forth in the presentation may not develop as predicted.
The Standard & Poor’s 500 Index is a capitalization-weighted index of 500 stocks designed to measure performance of the broad domestic economy through changes in the aggregate market value of 500 stocks representing all major industries.
Investing in stock includes numerous specific risks including: the fluctuation of dividend, loss of principal and potential illiquidity of the investment in a falling market.
The VIX is a measure of the volatility implied in the prices of options contracts for the S&P 500. It is a market-based estimate of future volatility. When sentiment reaches one extreme or the other, the market typically reverses course. While this is not necessarily predictive, it does measure the current degree of fear present in the stock market.
Indices are unmanaged and cannot be invested into directly. Unmanaged index returns do not reflect fees, expenses, or sales charges. Index performance is not indicative of the performance of any investment. Past performance is no guarantee of future results.
The opinions voiced in this material are for general information only and are not intended to provide or be construed as providing specific investment advice or recommendations for any individual security.
This research material has been prepared by LPL Financial LLC.
To the extent you are receiving investment advice from a separately registered independent investment advisor, please note that LPL Financial LLC is not an affiliate of and makes no representation with respect to such entity.
Not FDIC/NCUA Insured | Not Bank/Credit Union Guaranteed | May Lose Value | Not Guaranteed by any Government Agency | Not a Bank/Credit Union Deposit
Securities and Advisory services offered through LPL Financial LLC, a Registered Investment Advisor
Member FINRA/SIPC
Tracking # 1-607983 (Exp. 05/18)
Copyright © LPL Research


