The Seinfeld market, redux
by Jeffrey Saut, Chief Investment Strategist, Raymond James
So Andrew and I received a plethora of emails wanting to know what we meant about “A Seinfeld Market,” which was the title of Friday’s “Morning Tack.” As disclosed in that report, the concept was not ours, but rather Dr. Ed Yardeni’s as scribed in his insightful blog. Dr. Ed begins said blog by writing:
"The Pitch” is the 43rd episode of the TV sitcom Seinfeld. It is the third episode of the fourth season. It aired on September 16, 1992. In it, NBC executives ask Jerry Seinfeld to pitch them an idea for a TV series. His friend George Costanza decides he can be a sitcom writer and comes up with the idea of “a show about nothing.” The bull market in stocks since March 2009 has had a fairly simple script too. As a result of the Trauma of 2008, investors have been prone to recurring panic attacks. They feared that something bad was about to happen again, so they sold stocks. When their fears weren’t realized, the selloffs were followed by relief rallies to new cyclical highs and to new record highs since March 28, 2013. Their jitters are understandable given that the S&P 500 plunged 56.8% from October 9, 2007 through March 9, 2009. From 2009 through 2016, there were four major corrections and several significant scares. I kept track of them and the main events that seemed to cause them. By my count, there were 57 panic attacks from 2009 through 2016, with 2012 being especially anxiety-prone with 12 attacks. (See our: S&P 500 Panic Attacks Since 2009.)
Indeed “The Seinfeld Market,” a concept that was espoused by Barron’s eagle-eyed Ben Levisohn in his “Trader” column over the weekend. To wit:
For most of the week it looked as if nothing was going to happen at all. Through last Thursday’s close, the S&P 500 had gone seven days without a move of 0.2% or more in either direction. That’s the fifth time that the popular benchmark has gone at least that many days without such a move, according to Bespoke Investment Group. The lack of action was putting many observers on edge, but Bespoke notes that stocks generally move higher when such streaks end: Following low-volatility streaks of seven days or more, the S&P was 2.1% higher a month later on average.
Clearly, that is what our models are suggesting following their “flip” to a positive reading on April 19, 2017 and we have recommended tilting portfolios accordingly. At the time our models went on a “buy signal” the S&P 500 (SPX/2399.29) was trading around 2335, while the NASDAQ 100 (NDX/5646.09) was changing hands at ~5397.18. So early last week a reporter asked me, “Your models are ‘saying’ the equity markets are going to trade out to new all-time highs, but how can that be given the weakening economic reports?” Well, firstly the models are forward looking, not driving down the road looking in the rearview mirror. Second, over the past few months we’ve had several things that have had a negative impact on the economic reports: 1) slow tax refunds; 2) the actual tax day; 3) rents have increased noticeably; 4) gasoline prices are up; 5) we experienced some bad weather; 6) Easter fell at a weird time; 7) auto sales have slowed; 8) healthcare costs have leaped; and the list goes on. We, however, believe the economy will strengthen in the months ahead with last week being a step in that direction.
Meanwhile, the transition to an earnings driven secular bull market continues. As our friend Sam Stovall (CFRA Research) writes:
With the S&P 500’s first-quarter earnings-report period largely over, the initial estimate is again on track to be exceeded by the actual growth in earnings per share, as has been the case of the past 20 quarters. Indeed, the final year-on-year quarterly growth in S&P 500 EPS exceeded the beginning-of-quarter estimate by an average 3.5 percentage points. It now appears as if first-quarter 2017 results will be no exception, as the March 31 estimate of +9.9% according to S&P Capital IQ, will now come in closer to +14%. Expectations for forward-quarter outcomes are probably contributing to equity optimism.
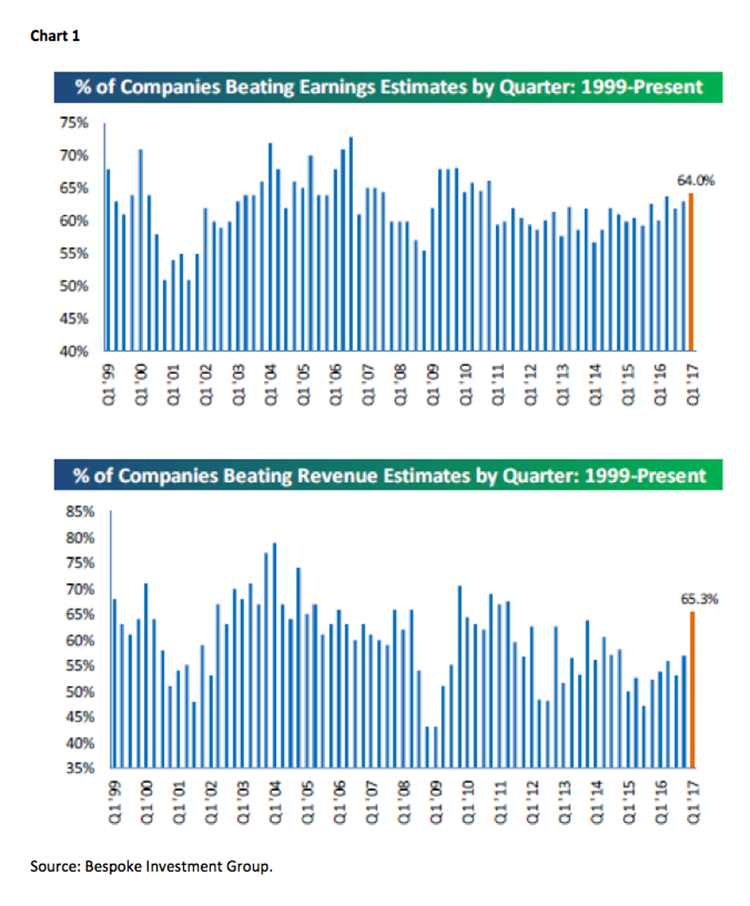
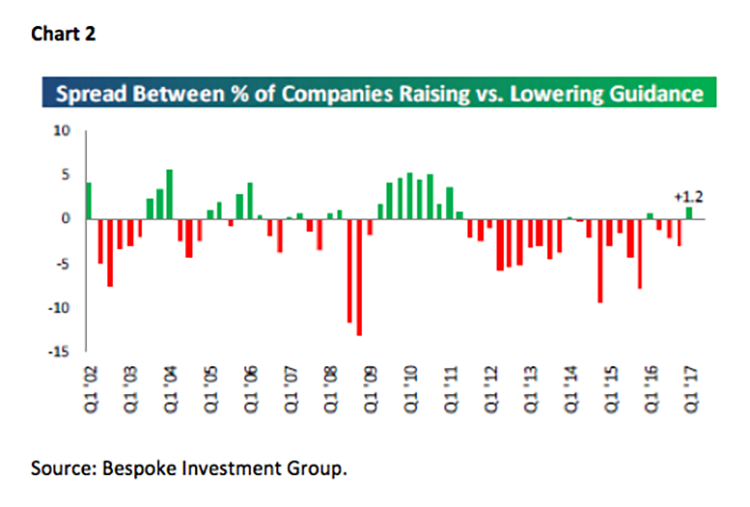
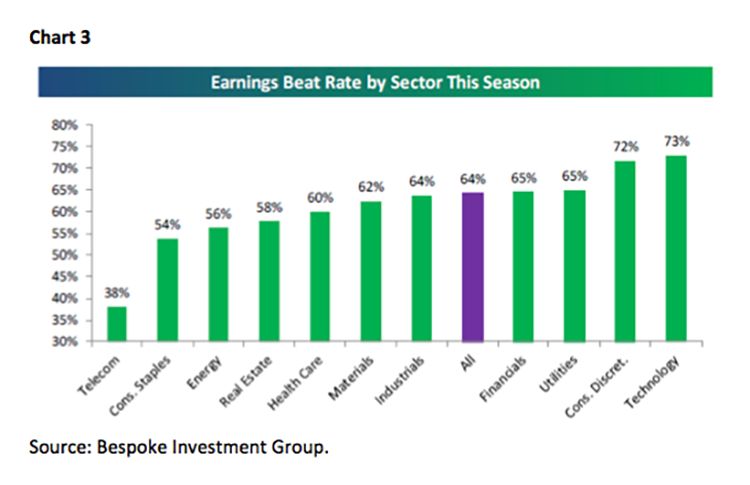
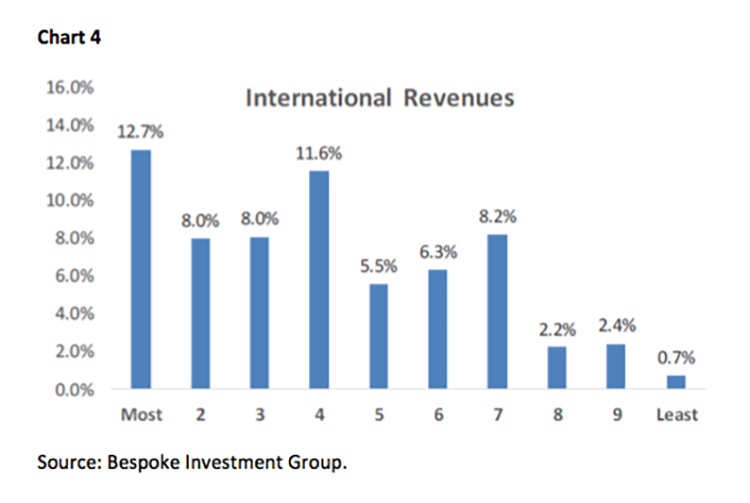
To be sure, with over 1800 companies reporting earnings, the record shows that 64.0% of them have beaten the consensus earnings estimates and 65.3% have bettered the consensus revenue estimates (Chart 1). This revenue “beat rate” is decidedly positive, since it has not happened since 2Q14. Importantly, more companies are raising forward earnings guidance than companies lowering guidance (Chart 2). Breaking out the earnings “beat rate” by sector, shows that technology and consumer discretionary have the highest “win ratios,” while telecom has the worst (Chart 3). Of interest is that the stocks with the most international revenues have performed the best (Chart 4). What do you think is going to happen when the stimulus from the new administration kicks in over the next few years?!
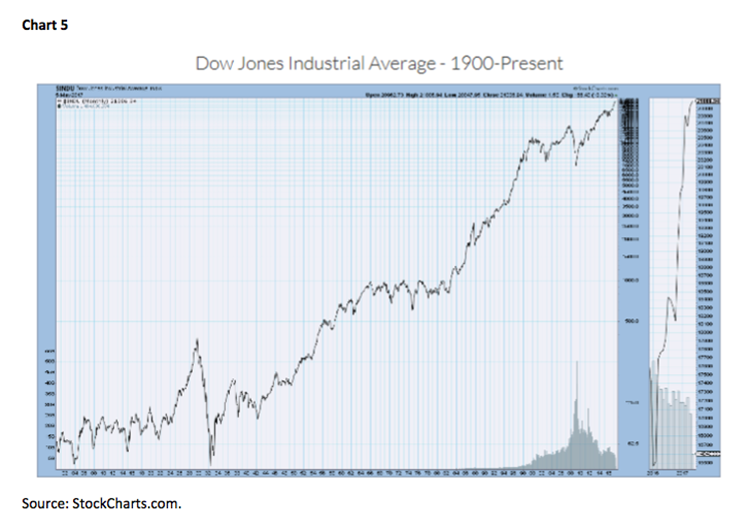
So, we have decent earnings growth and it is likely to continue. That means stocks are not all that expensive, based on future earnings. As we have argued in the past, there are more high growth/high margin companies populating the S&P 500 than ever before, which by definition implies valuations should be higher. Then there is the switch from tangible asset to intangible asset. For example, in 1985 companies had some 85% in tangible assets and 15% in intangible assets. Now that ratio is completely reversed. Hereto, by definition, that implies higher valuations. Finally, if you take out the aberrationally low P/Es of the 1970s and 1980s due to high inflation and high interest rates, and sum the beginning of the year P/Es for the S&P 500 starting in 1990, the average P/E is 23.85. Moreover, our work suggests “smart money” is accumulating equities. Professional money is buying on weakness and not selling on strength. Investor sentiment remains in a funk and you can read that as bullish. Finally, we are in a secular bull market “super cycle.” Studying Chart 5 show that such bull markets tend to last 15+ years, so even if you start the “count” in March of 2009 we should have another 7+ years left in this cycle. As we have noted in the past, however, it is likely this “bull market” began in either October 2011, or in April of 2013. As Zor Capital’s portfolio manager Joe Fahmy writes:
Think of everything that’s been thrown at this market over the past few years: geopolitical concerns, dramatic elections, viruses, Brexit, terrorist attacks, etc., and guess what? The market has been INCREDIBLY resilient and literally brushes off bad news. Now, imagine if the news over the next year or two actually turns positive.
The call for this week: Well, Macron won the French election. And, something is happening across Europe that many have missed: the mainstream left is getting crushed. The preopening futures initial reaction to that news was a leap higher, but since then they have come back to earth at -3.75 at 5:00 a.m. Of course that is in keeping with our models that forecast another week of timidity for the equity markets before a lift off to new all-time highs. Meanwhile, a 152,000 of the 211,000 Nonfarm Payrolls number was due to a change in seasonal adjustments (fake news), consequently a June interest rate ratchet is highly likely, the NY Fed cut its 2Q17 GDP estimate to 1.8% from 2.3%, Gary Cohn said the “Tax Plan Will Offer CEOs One Time Incentive to Bring Cash Back to U.S.A.,” U.K. retailers report weak sales in April, “Puerto Rico Declares ‘Bankruptcy’ Due to $123 Billion in Debts,” and the list goes on. As we write, the S&P futures are down 3.70. We will closely watch the first-hour indicator. If the S&P 500 Index jumps to a new high early, the first-hour low will be important support and the first-hour high will be resistance. The early Monday morning downside reversal should trouble bulls. And, that’s the way it is as we board a plane for Michigan . . .
Copyright © Raymond James