
by Lance Roberts, Clarity Financial
With April now behind us, investors now enter into the seasonally weak 6-month period of the year. It is also the annual “right of passage” as the debate over the old Wall Street axiom “Sell In May And Go Away,” rages. As I noted in last week’s Technical Update:
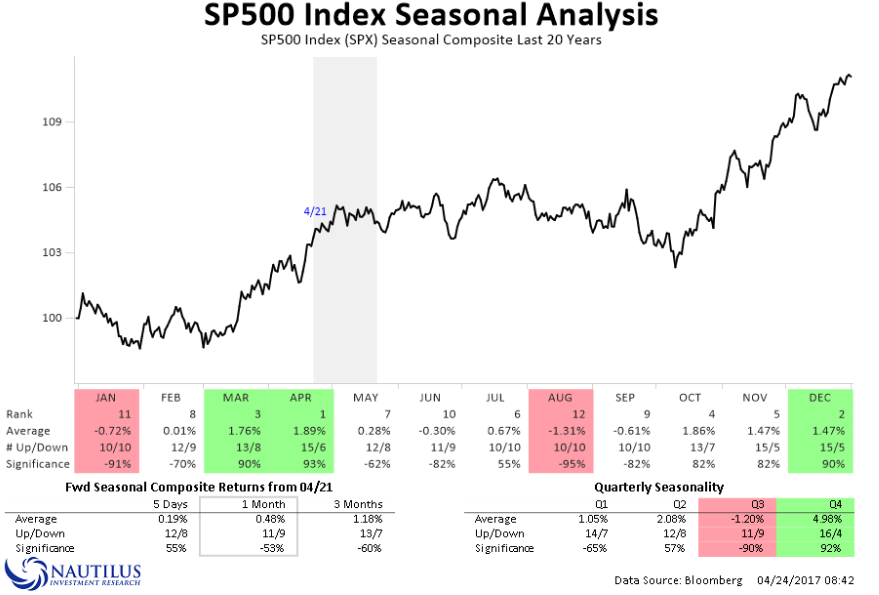
“As we wrap up the month of April, we now begin the march into the seasonally weaker period of the year. As noted by Nautilus Research, the markets tend to get choppy over the next couple of months.” (See Graph Below)
Just recently at the 2017 Economic & Investment Summit, Greg Morris made an interesting statement worth considering in today’s discussion:
“If you believe something that you learned from your parents, or teachers, when you were young and have never questioned; how many things about investing and finance do you believe today but have never questioned?”
It is from this point that I want to discuss the issue of “Sell In May.”
Let’s start with a basic assumption.
I am going to give you an opportunity to make an investment where 70% of the time you will win, but by the same token, 30% of the time you will lose.
It’s a “no-brainer,” right?
So, you invest and immediately lose. In fact, you lose the next two times, as well. Unfortunately, you just happened to get all three instances, out of ten, where you lost money. Does it make the investment any less attractive? No.
But this is exactly what happens to investors all the time. They read about some investment strategy, or discipline, that historically has had a very high success rate, so, they jump in. Of course, as luck would have it, the next year market dynamics change somewhat and the strategy doesn’t work. Since, whatever strategy is obviously flawed, they jump to the next “hot” trend from last year.
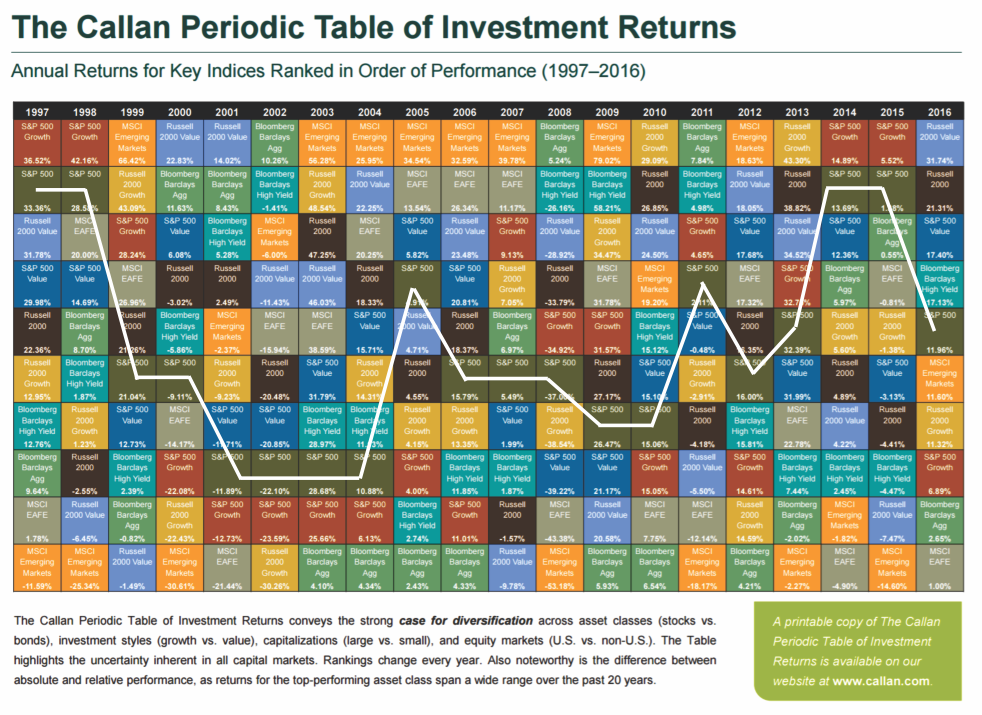
This “rotation” can be seen in the Callan Periodic Table Of Returns. Most investors tend to “buy” whatever was “hot” last year, but as you can see, it rarely stays that way for long.
Wash. Rinse. Repeat.
In most instances, the analysis of “Sell In May” typically uses too short of a timeframe looking back only to the beginning of the last secular “bull market” that begin in the early 1980’s. Even Nautilus’ analysis above, while excellent, only looks back at the last 20-years. In order to properly analyze the historical tendencies of the markets, particularly given the impact of Central Bank interventions in recent years, we need a more extensive data set.
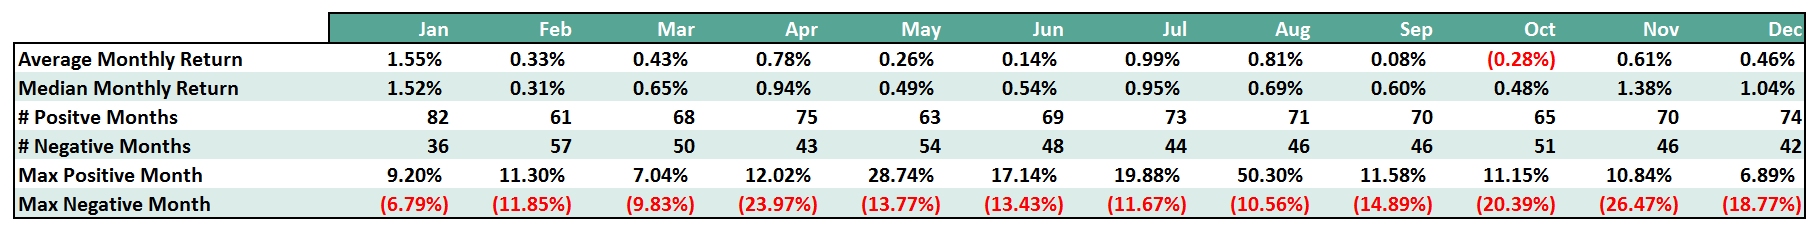
Therefore, using the monthly data provided by Dr. Robert Shiller, let’s take a look at the seasonally strong versus weak periods of the year going back to 1900. The table below, which provides the basis for the rest of this missive, is the monthly return data from 1900-present.
Using the data above, let’s take a look at what we might expect for the month of May
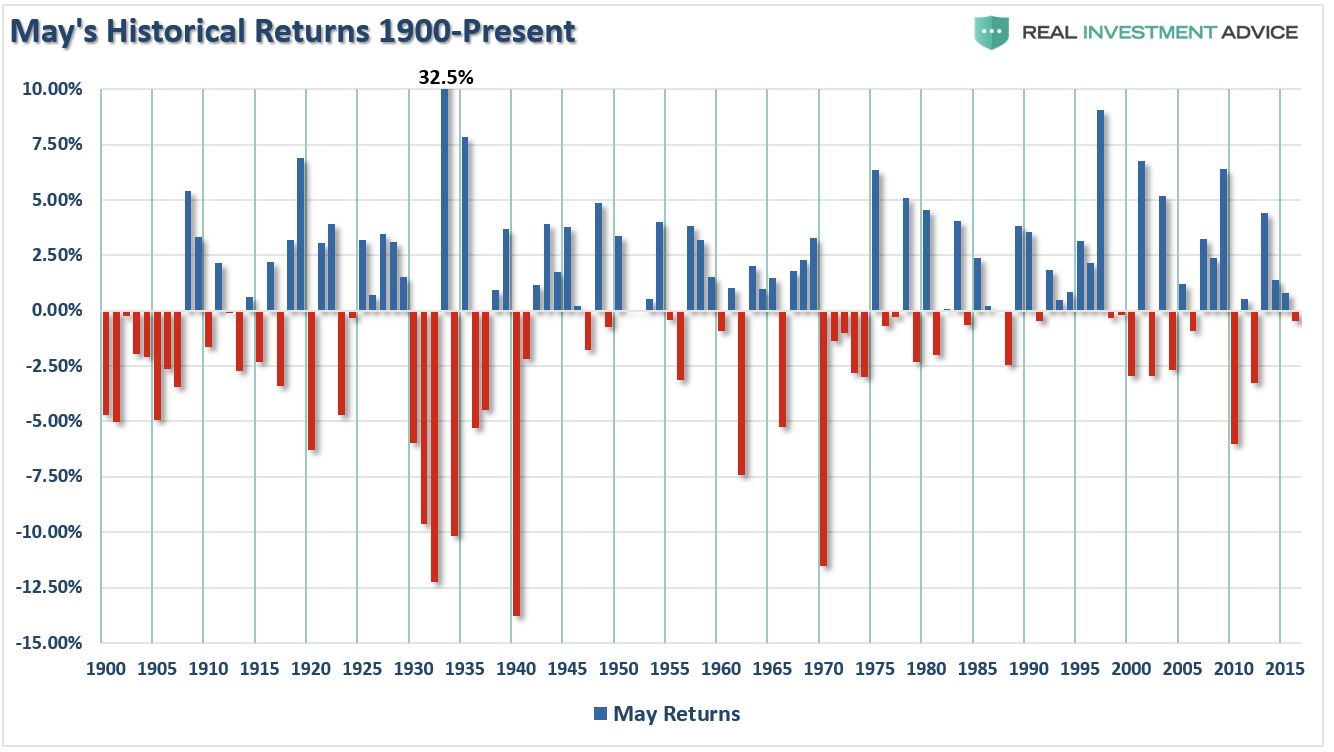
Historically, May is the 4th WORST performing month for stocks with an average return of just 0.26%. However, it is the 3rd worst performing month on a median return basis of just 0.49%.
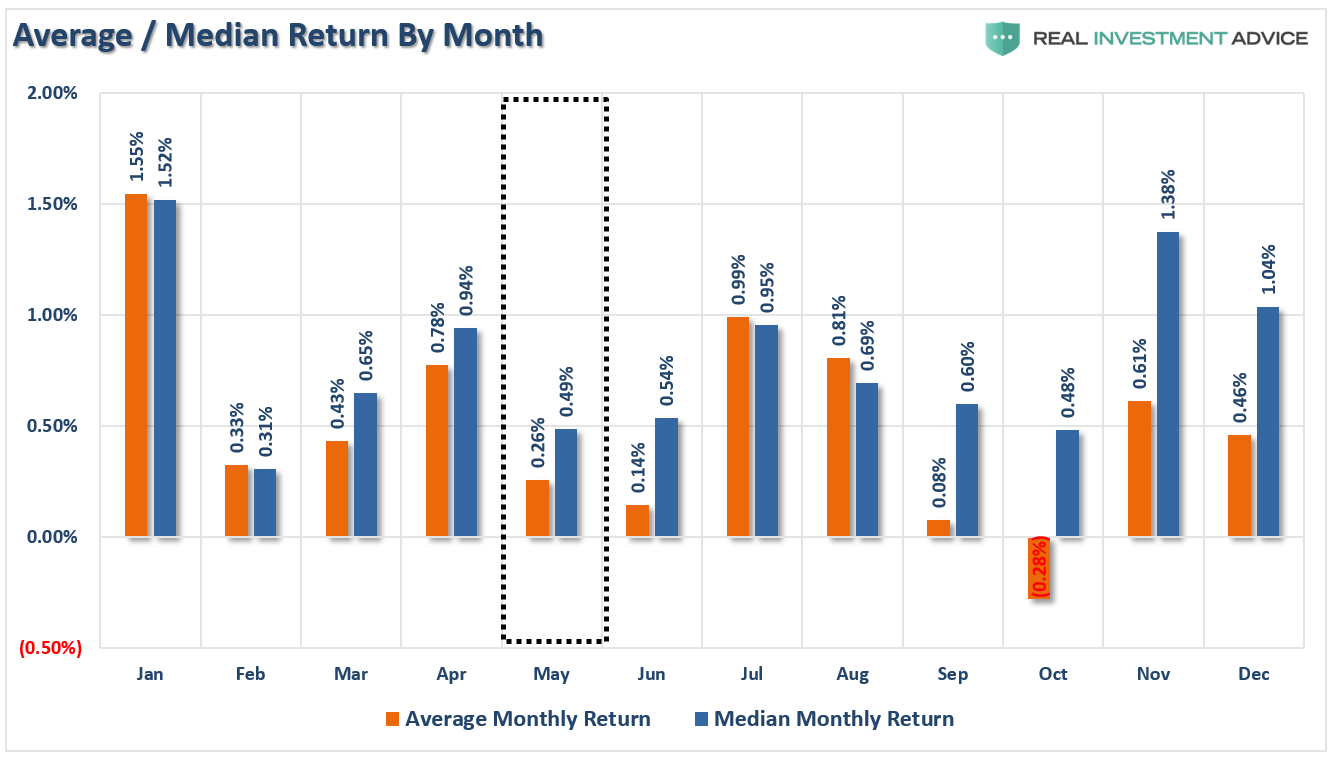
(Interesting note: As you will notice in the table above and chart below, average returns are heavily skewed by outlier events. For example, while October is considered the “worst month” with an average return of -0.32%, the median return is actually a positive 0.39% which makes it just the 2nd worst performing month of the year beating out February [the worst].)
As noted, May represents the beginning of the “seasonally weak” period for stocks. As the markets roll into the early summer months, May and June tend to be some of weakest months of the year along with September. This is where the old adage of “Sell In May” is derived from. Of course, while not every summer period has been a dud, history does show that being invested during summer months is a “hit or miss” bet at best.
Like October, May’s monthly average is skewed higher by 32.5% jump in 1933. However, in more recent years returns have been primarily contained, with only a couple of exceptions, within a +/- 5% return band as shown below.
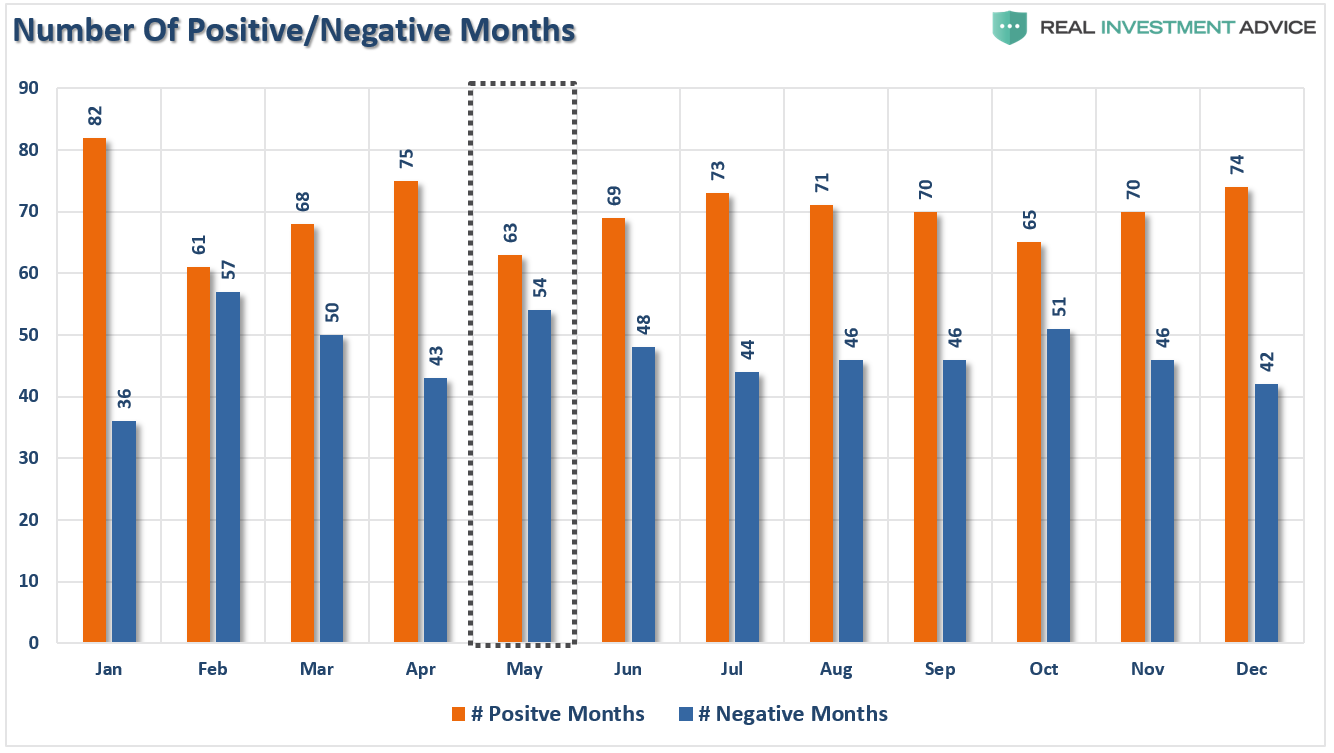
The chart below depicts the number of positive and negative returns for the market by month. With a ratio of 54 losing months to 62 positive ones, there is a 46% chance that May will yield a negative return.
No Reason To Sell Just Yet
Based on the historical evidence it would certainly seem prudent to “bail” on the markets, right? Maybe not. The problem with statistical analysis is that we are measuring the historical odds of an event occurring in the near future. Like playing a hand of poker, the odds of drawing to an inside straight are astronomically high against success. However, it doesn’t mean that it can’t happen.
Currently, the study of current price action suggests that the markets will likely break out to new highs in the days ahead. Such action, should it occur, will continue to support the “bullish case” for equities for now. This is why, as I have reiterated in our weekly missive, that portfolio allocations should remain biased toward equities. To wit:
“With the market on a short-term “buy signal,” deference should be given to the probability of a further market advance heading into May. With earnings season in full swing, there is a very likely probability that stocks can sustain their bullish bias for now.”
And again in Return Of The Bull…For Now
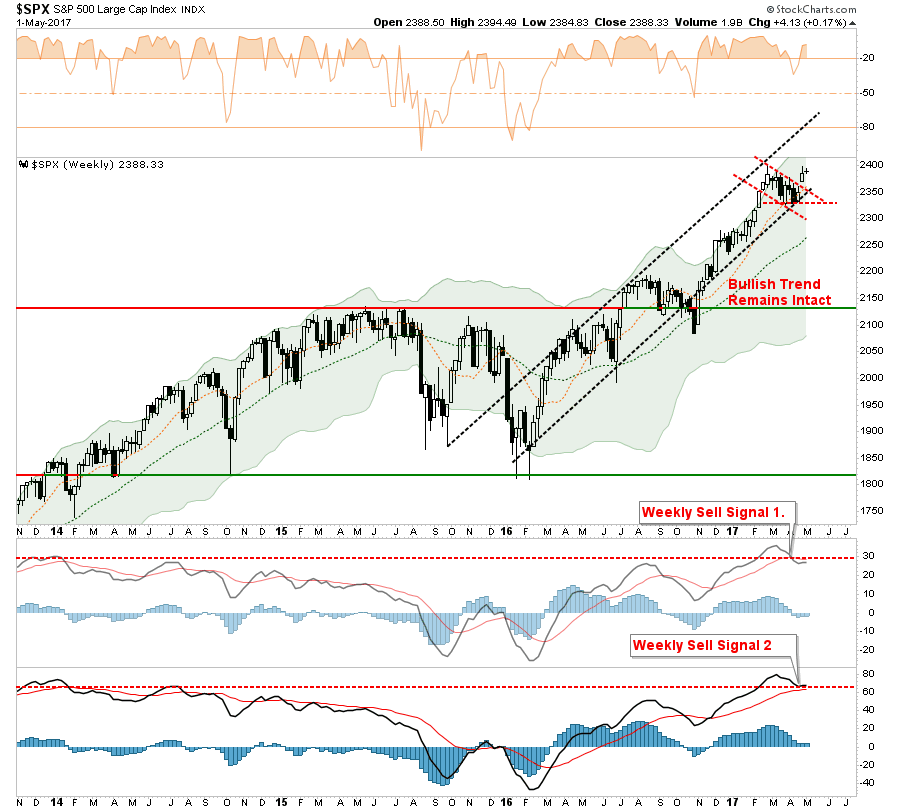
“Clearly, the bullish trend on both a daily and weekly basis remains intact. This keeps portfolio allocations on the long side for now.”
However, the “risk” to investors is not a continued rise in the markets, but the risk of a sharp decline. As discussed in “The Math Of Loss:”
The reason that portfolio risk management is so crucial is that it is not “missing the 10-best days” that is important, it is “missing the 10-worst days.” The chart below, from Greg Morris’ recent presentation, shows the comparison of $100 invested in the S&P 500 Index (log scale) and the return when adjusted for missing the 10 best and worst days.
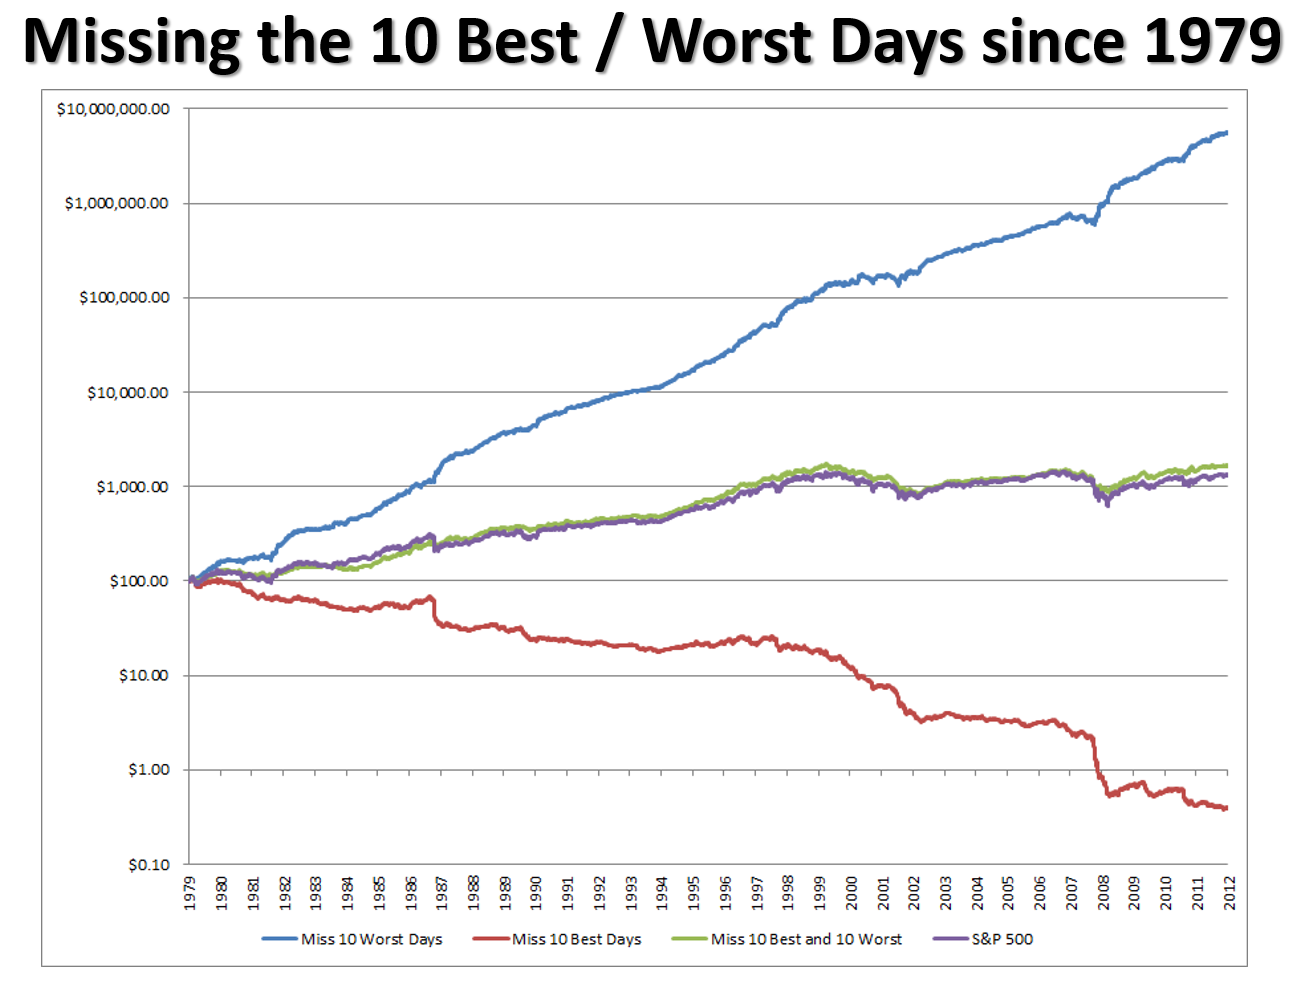
Clearly, avoiding major drawdowns in the market is key to long-term investment success. If I am not spending the bulk of my time making up previous losses in my portfolio, I spend more time compounding my invested dollars towards my long term goals. As Greg notes in his presentation, the markets are only making new highs roughly 4% of the time. Spending a bulk of bull market cycle making up previous losses is hardly a successful investment strategy one can utilize.
Since our job, as investors, is to compound our investment over time, the REAL RISK is NOT MISSING UPSIDE in the markets, but CAPTURING DECLINES. The destruction of investment capital is far more damaging to long-term investment goals than simply missing a potential for rather limited gains at this very late juncture of the investment market cycle.
The chart below shows the gain of $10,000 invested since 1957 in the S&P 500 index during the seasonally strong period (November through April) as opposed to the seasonally weak period (May through October).
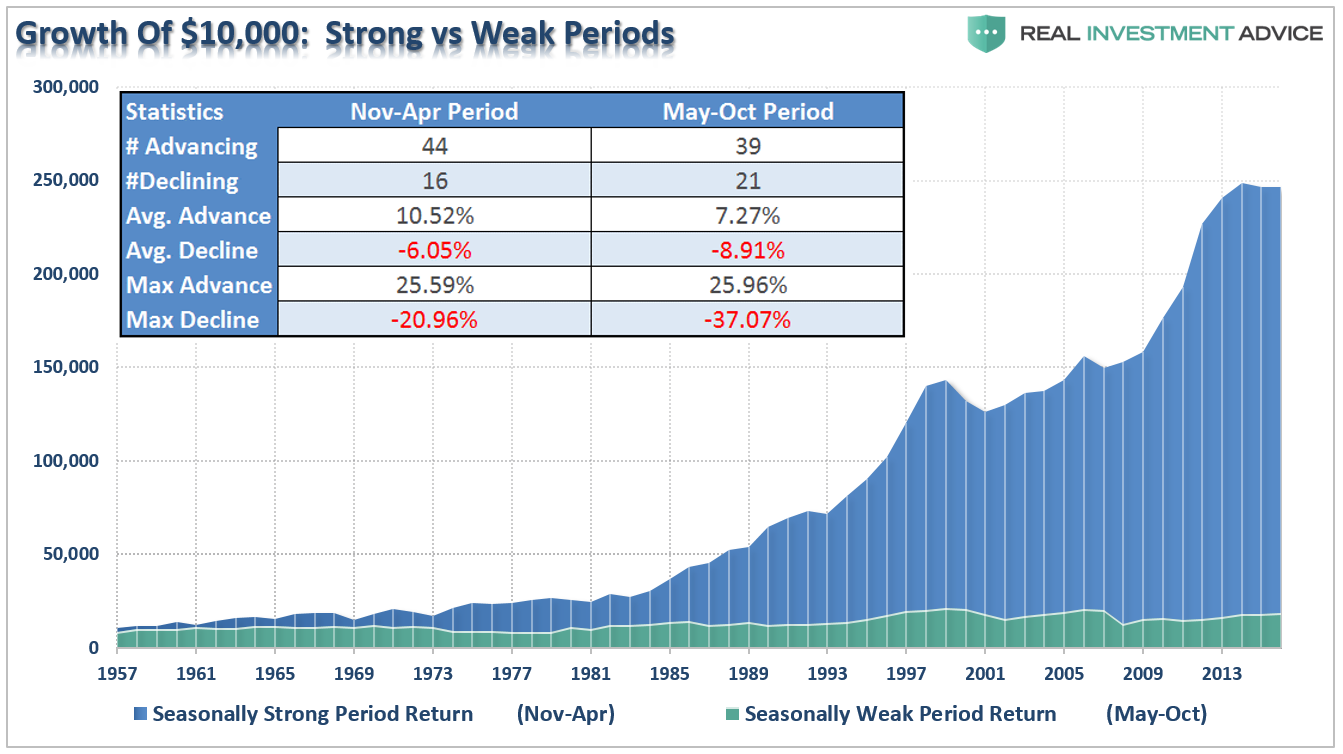
It is quite clear that there is little advantage to be gained by being aggressively allocated during the summer months. However, in reality, there are few individuals that can maintain a strict discipline of only investing during seasonally strong periods consistently. Also, time frames of when you start and when you need your capital for retirement make HUGE differences in actual performance.
That is why, for investors, while the data is certainly interesting, it yields little. For investors, market returns cannot be anticipated with any given degree of certainty from one day to the next. No one has that ability. What we do know, is that eventually, prices will take a turn for the worse and history shows that there will be little warning, fanfare or acknowledgment that something has changed.
As the trend reverses, it will initially be met with denial, followed by hope, and ultimately acknowledgment, but only well after the fact.
As shown in the chart below, we are currently on intermediate-term sell signal and overbought with a secondary sell signal approaching. Both are occurring from very high levels which suggests the current rally should likely be used for portfolio repositioning and rebalancing. However, such a statement does NOT mean “cashing out” of the market as the bull market trend remains intact. Maintain, appropriate portfolio “risk” exposure for now, but cash raised from rebalancing should remain on the sidelines until a better risk/reward opportunity presents itself.
With our portfolios invested at the current time, it makes little sense to focus on what could go right. You can readily find that case in the mainstream media which is biased by its needs for advertisers and ratings. However, by understanding the impact to portfolios when something goes “wrong” is inherently more important. If the market rises, terrific. It is when markets decline that we truly understand the “risk” that we take. A missed opportunity is easily replaced. However, a willful disregard of “risk” will inherently lead to the destruction of the two most precious and finite assets that all investors possess – capital and time.
Just something to consider when the media tells you to ignore history and suggests “this time may be different.”
That is usually just about the time when it isn’t.
Lance Roberts

Lance Roberts is a Chief Portfolio Strategist/Economist for Clarity Financial. He is also the host of “The Lance Roberts Show” and Chief Editor of the “Real Investment Advice” website and author of “Real Investment Daily” blog and “Real Investment Report“. Follow Lance on Facebook, Twitter and Linked-In
Copyright © Clarity Financial