
This week in the Equity Leaders Weekly, we are going to re-examine the British Pound/US Dollar relationship as the GBPUSD as Britain triggered Article 50 starting their official divorce from the EU. Secondly, we will look at important comparison of U.S. Equity vs Canadian Equity from a relative basis to revisit the long-term equity direction and trends.
British Pound/ United States Dollar (GBPUSD)
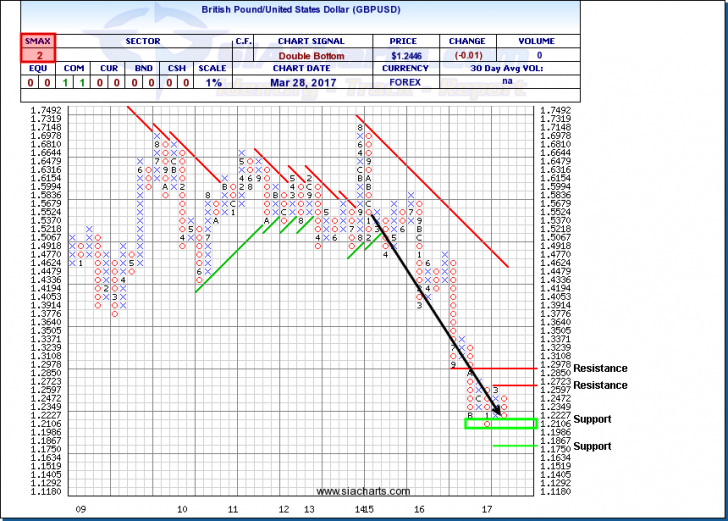
Britain’s divorce from the EU is now under way as Prime Minister Theresa May triggered Article 50 of the European Union (EU) Treaty yesterday. What this means is that the United Kingdom (UK) will leave the EU in March of 2019 unless an extension is agreed upon. So this begins a two year negotiation process, especially on issues concerning what the UK needs to pay to settle its accounts with the EU. If negotiations do sour between Britain and the EU, the UK may have the most to lose, but it wouldn’t do any favors for the overall European markets either.
As the world’s fifth largest economy, Britain’s ‘Brexit’ actions influence global trade and currency movement. So taking a look back at the British Pound vs. the US Dollar (GBPUSD) relationship will help us understand how the current state is being reflected in the currency. We last looked at the GBPUSD in June of 2016 when Brexit was initially voted on at $1.3339 and again in October of 2016 when it was trading at $1.2723. Currently trading at $1.2446, the currency relationship in SIACharts has been favoring USD over GBP since the beginning of 2016 before the Brexit vote and has continued ever since during this current drawdown of the Pound.
The current support and resistance levels have formed a range around the current volatility with resistance above at $1.2723 and $1.2978 and support to the downside $1.2 and at $1.175 which are levels that would be all-time lows for the currency. The comparison SMAX score is currently in favor of the USD over the GBP, but with potentially volatile negotiations ongoing for the next 2 years of this divorce from the EU, you will continue to want to monitor this chart and the relative strength rankings of other currency relationships going forward.
Click on Image to Enlarge
S&P 500 Index (SPX.I) vs. S&P/TSX Composite Index (TSX.I)
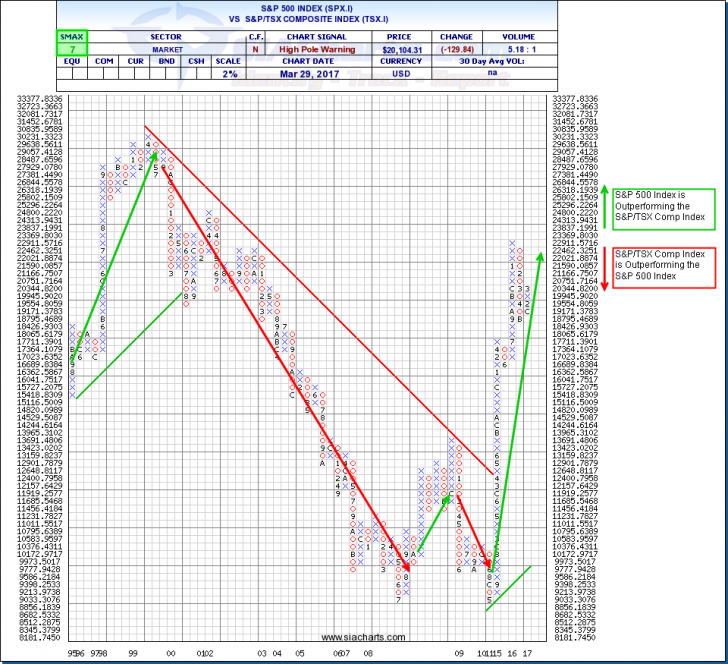
We wanted to revisit this important comparison chart between the broad U.S. Equity market versus the broad Canadian Equity market as these are some of the top asset classes currently in the SIA Asset Class Rankings. This point and figure comparison chart shows the last 20 years of this relative relationship with every X in the chart showing a 2% outperformance of U.S. Equity over Canadian Equity and every O showing a 2% outperformance in favor of Canadian Equity over US. US Equity was winning this battle in the late ‘90s with Canadian Equity winning this battle for much of 2000 through 2008.
Looking back at our historical Asset Class Rankings, US Equities since 2011, has ranked ahead of Canadian Equity for almost the entire period which you can see visually in the comparison chart with the upwards green arrow showing the relative outperformance between these 2 countries over the last 5 years. So although the Canadian Equity market outperformed the US market in Q1 of 2016, the long-term trend in still in favor of U.S. Equity and has a comparison SMAX score of 7 in favor of the S&P 500 currently.
Click on Image to Enlarge
SIACharts.com specifically represents that it does not give investment advice or advocate the purchase or sale of any security or investment. None of the information contained in this website or document constitutes an offer to sell or the solicitation of an offer to buy any security or other investment or an offer to provide investment services of any kind. Neither SIACharts.com (FundCharts Inc.) nor its third party content providers shall be liable for any errors, inaccuracies or delays in content, or for any actions taken in reliance thereon.
For further discussion on this relationship and what it means for your portfolios, you can contact our customer support at 1-877-668-1332 or siateam@siacharts.com.
Copyright © SIACharts.com