
by Jodie Gunzberg, Head of Commodities and Real Assets, S&P Dow Jones Indices
Although OPEC agreed to cut production to help support the oil price, they may have miscalculated their power as a cartel. The U.S. producers are filling in the gap causing inventories to soar, and that has caused the S&P GSCI Crude Oil index to fall 9.4% this month. It is the biggest 9-day decline since the period ending Nov. 7, 2016, when OPEC raced to produce ahead of the planned supply cut implementation.
Generally there is a low correlation of 0.28 between non-energy and energy commodities, using daily data back to Jan. 2, 1987. Recently, the correlation has been rising, and while not excessively high, the pace at which it is increasing is noticeable. On Jan. 13, 2017, precisely two months ago, the 30-day correlation between the S&P GSCI Energy and S&P GSCI Non Energy was -0.11, increased to 0.05 by Mar. 1, and is now 0.35, going from uncorrelated to moderately correlated in a short time.
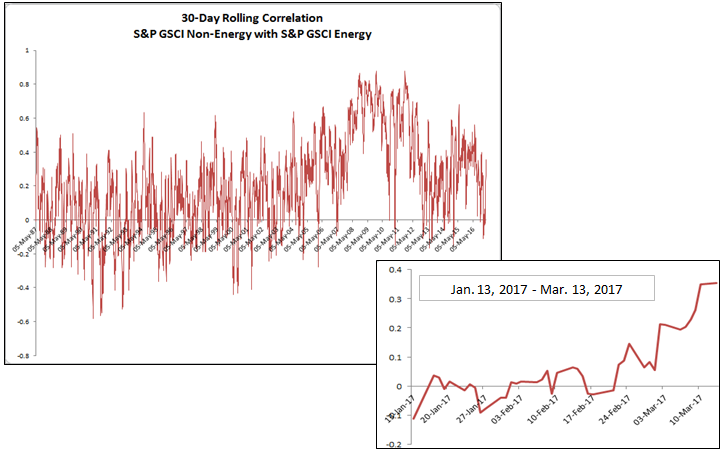
Source: S&P Dow Jones Indices.
Now there are 17 commodities besides crude oil that are negative month-to-date through March 13, 2017, that is the most down in a month with oil since Nov. 2015, when there were 21 down. It is far worse than when oil was down in Jan. 2017 with only 9 other commodities.
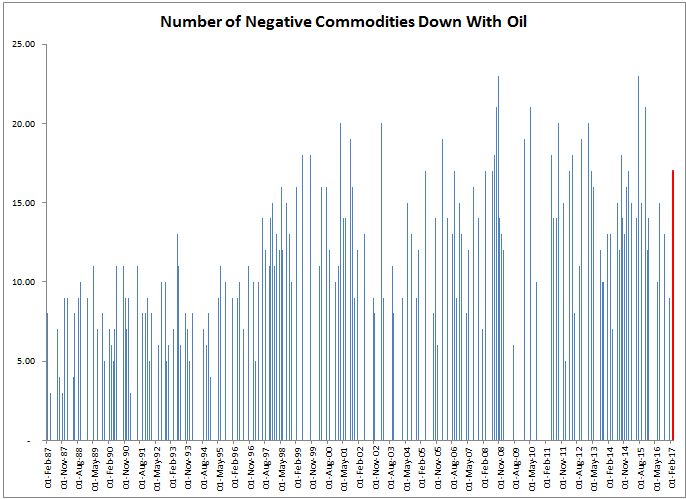
Source: S&P Dow Jones Indices.
Finally, the commodities that usually hold up with oil declines are now crumbling. Normally several of the agriculture and livestock (coffee, soybeans, wheat, live cattle, lean hogs and corn) do well on average when oil drops. Historically, corn holds up best, gaining 56 basis points on average in months oil falls. Further, none of the non-energy commodities typically lose more than 1% in an average month that oil loses, but now the losses are substantial with greater than 1% drops month-to-date in 12 of 13 non-energy commodities that are down with oil.
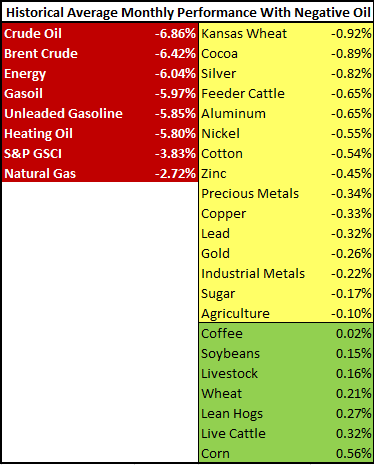
Source: S&P Dow Jones Indices.
Silver, live cattle and nickel are worst performing so far through March, 13, down 8.1%, 8.3% and 7.4%, respectively. Additionally, every sector is negative for the first time since Nov. 2015, including the industrial metals that were so promising have now fallen near 3% month-to-date in Mar. with only lead marginally positive, putting into question the optimism of growth that industrial metals (copper) are known for predicting,