by Jodie Gunzberg, Global Head, Commodities and Real Assets, S&P Dow Jones Indices
U.S. home prices hit a new record high as measured by the S&P CoreLogic Case-Shiller U.S. National Home Price NSA Index setting an all-time high in three consecutive months (with data ending in Nov.) It’s not the only indicator showing signs of growth and inflation as U.S. consumer spending accelerated in December as households bought motor vehicles and cold weather boosted demand for utilities amid a rise in wages, pointing to sustained domestic demand that could spur economic growth in early 2017.
January was an eventful month with President Trump’s inauguration, and with his new administration promising to cut taxes, it could accelerate consumer spending. Although Trump’s economic policy is still unfolding, consumer confidence has surged and commodities ex-energy are having their strongest start since 2012, up 4.4% in Jan., the 9th strongest in history since 1970.
However, energy, the worst performing sector in Jan., detracted from both the S&P GSCI Total Return and DJCI (Dow Jones Commodity Index). Energy lost 4.7% in the S&P GSCI Total Return for an overall monthly loss of 1.4%, while energy lost 5.1% in the DJCI limiting its gain to 0.7% in Jan. The bigger energy sector loss in the DJCI comes from its heavier liquidity-based weight to natural gas, the worst performing commodity in Jan. with a total return loss of 16.1%, but the greater energy sector impact on the S&P GSCI is attributed to the heavier weight in the sector from the index’s world-production weight.
Two forces weighing on petroleum now are production decisions from OPEC and the U.S., and the tax policy that will potentially create a disparity between incentives of producers and processors by encouraging producers to export, but processors to buy domestically. If this promotes more domestic oil production, holding WTI crude oil will likely continue to be more expensive than holding brent. Jan. marked the second consecutive month the negative roll yield on WTI was bigger than for brent, diluting an extra 62 basis points for the month – after losing an extra 67 basis points last month for the biggest combined loss since Aug.-Sep. 2016. If this U.S. production continues to rise, it could take another 2 years to reach equilibrium before setting a record long stretch of contango. Additionally, the gas price will need to rise more (from the tax) than the oil prices falls in order to keep inflation up. In Jan. unleaded gasoline lost about 5.5% more than oil, which is pretty significant, but once the tax kicks in, that might change.
Despite losses in all 6 commodities in the energy sector, 13 of 24 commodities were still positive in Jan. Livestock was the other losing sector, down 1.1% for the month. Agriculture and precious metals gained 3.5% and 5.5%, respectively for the month. Industrial metals gained 5.4%, making it the best performing sector in Jan.
It’s difficult to attribute any commodity performance to Trump yet since he only took office on Jan 20, but it looks like oil fundamentals are holding based on production while aggregate demand hopes are driving industrial metals. The S&P GSCI Industrial Metals average rolling correlation is increasing significantly since the election with the average rolling 30-day correlation rising to 0.60 from 0.37 while the 90-day that is smoother is rising from 0.38 to 0.50.
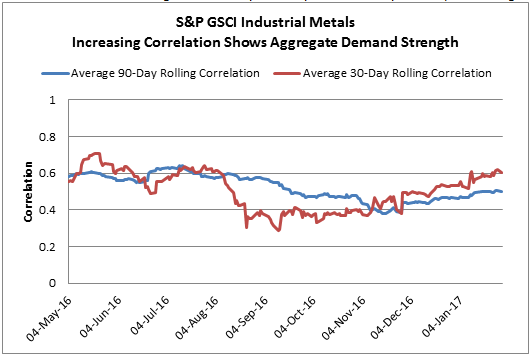
Source: S&P Dow Jones Indices
While industrial metals are sensitive to their unique supply issues, the higher correlation does show strength from aggregate demand. 4/5 industrial metals were positive in Jan. (nickel slightly lost,) which shows strength. Historically, this many industrial metals only rise together about 1/3 of the time, and all 5 rise together only about 1/5 times.
Inside the S&P GSCI Industrial Metals Total Return sector, lead performed particularly well gaining 17.9%, delivering its best month since July 2010 and 11th best ever on record (since Jan. 1995.)
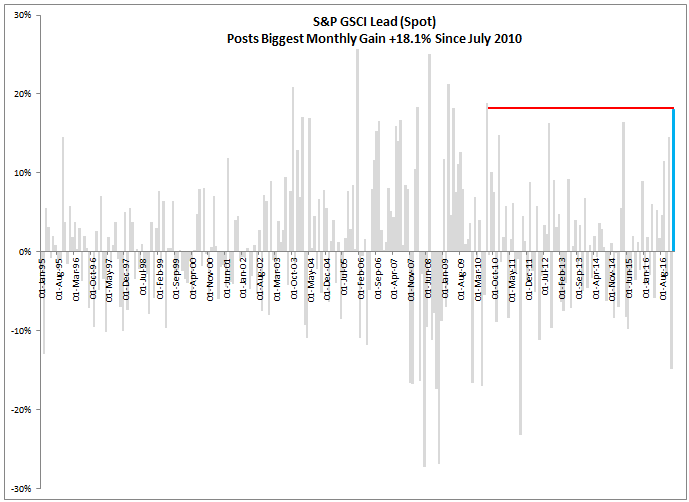
Source: S&P Dow Jones Indices
Last, the weaker dollar from the year’s beginning may have also significantly boosted industrial metals, especially lead, that typically gains most from a weaker dollar, gaining on average over 7% for every 1% the dollar falls.
This article is a publication of S&P Dow Jones Indices LLC. © S&P Dow Jones Indices LLC 2016. S&P® is a registered trademark of S&P Financial Services LLC. Dow Jones® is a registered trademark of Dow Jones Trademark Holdings LLC. S&P Dow Jones Indices LLC is not an investment advisor. This publication is not a recommendation by S&P Dow Jones Indices to buy, sell, or hold a security, nor is it considered to be investment advice.
Copyright © S&P Dow Jones Indices