
by James Morrow, CFA | Portfolio Manager Naveed Rahman | Institutional Portfolio Manager Srinivas Vemparala | Quantitative Analyst, Fidelity Investments Canada
Dividend-paying companies with attractive valuations, low payout ratios, and the ability to grow dividends have provided compelling value over the long term, and especially during rising-rate environments
Key Takeaways
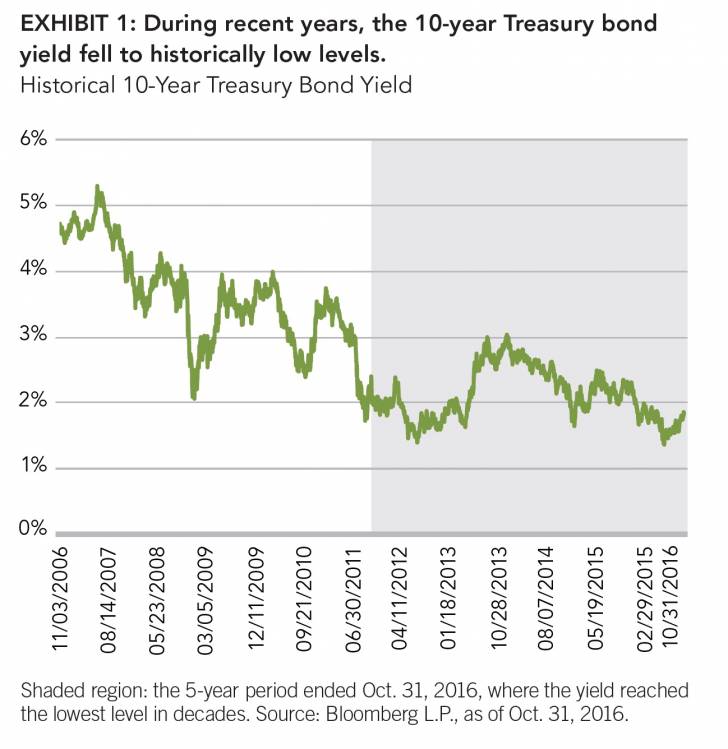
• As interest rates fell to historically low levels during the past five years, more investors turned to non-bond sources of income, such as dividend-paying equities.
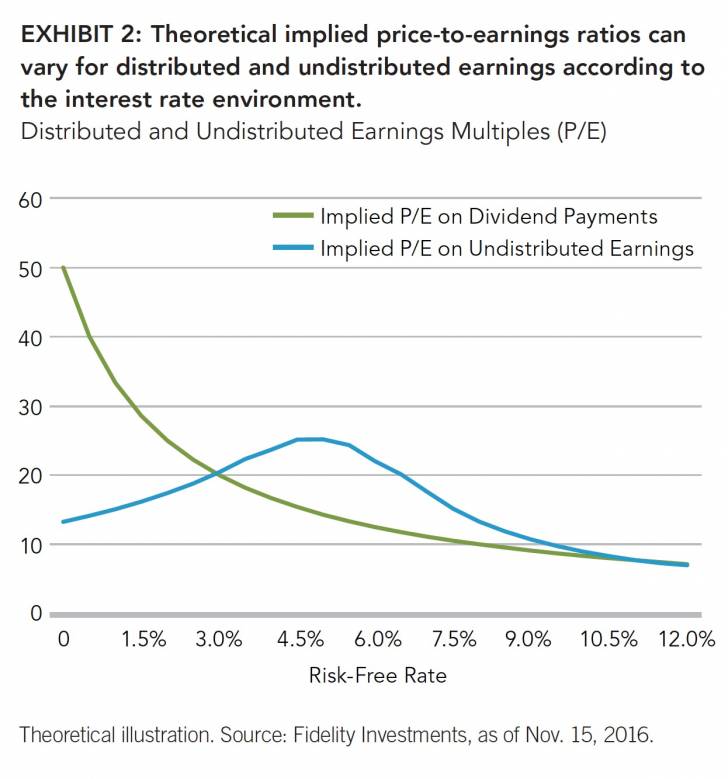
• During this five-year period, the broader mar.ket has placed higher valuations on a compa.ny’s distributed earnings (i.e., dividends) and less value on its undistributed earnings.
• With increasing wage inflation and other factors suggesting that the Fed may increase policy rates in the near term, the market’s bifurcated view of dividends vs. undistributed earnings could change.
• Historically and during periods of rising rates, stocks with high dividend yields and low pay.out ratios have outperformed those with high yields and high payout ratios.
• An actively managed approach that can move in and out of sectors and securities to source dividend yield may matter more in the near-to-intermediate term than it has during the past several years.
During the past five years, historically low interest rates have forced many investors to seek income from non-bond sources, including dividend-paying stocks. This penchant for yield led to strong demand for divi.dend-paying stocks in general, a group that typically
trades at a discount or lower valuations to non-dividend-paying stocks due to their historically slower rate of earnings growth. Within the universe of dividend-paying equities, the robust demand for yield also created wide valuation anomalies. Companies with the highest payout ratios—those paying a higher percentage of earnings back to shareholders in the form of dividends—earned the highest valuations, even relative to other dividend-paying stocks with better dividend growth prospects and lower payout ratios. In short, investors were willing to pay a premium for high absolute yield. The following article explores the dynamics of this recent environ.ment, provides a historical look at the performance of dividend-paying stocks during periods of rising and falling rates, and concludes with a perspective on where investors may want to source equity-income stocks if the environment changes.
Unprecedented shift in macro backdrop provided a tailwind to dividend-paying stocks
The extended decline of bond yields in the U.S. and around the world during the past several years served as the catalyst for significant change within the financial markets, and specifically with respect to dividend-paying stocks. When nominal rates fell to 50-year lows in recent years (Exhibit 1), many investors felt the need to source current income from non-bond investments. This need caused an increase in the value of dividends on a stand.alone basis, apart from their role in equity valuations. The market increasingly took a bifurcated view on company earnings, treating distributed earnings (i.e., dividends) and undistributed earnings very differently. As the past few years have shown, the lower interest rates fell, the higher investors generally valued dividend payments (Exhibit 2).
As investors gravitated to dividend-paying stocks as an alternative source of income relative to the available opportunity set in other asset classes, dividend-paying stocks outperformed the broader U.S. equity market and provided lower volatility. The key drivers of these positive results were the backdrop of low rates, and the market’s demand for yield. Other fundamental factors that typically drive long-term stock outperformance, such as strong earnings or free cash flow, took a backseat to yield. As a case in point, the high-dividend-yielding utilities sector delivered 11% lower operating income1 and consistently negative free cash flow from mid-2014 to mid-2016. Still, utilities stocks returned 27% as a group over the period, outperforming the broader U.S. equity market by roughly 15 percentage points. Not surprisingly, it was an expansion of the P/E multiple of utility stocks, from 16.5 to 19, rather than earnings growth, that accounted for the majority of outperformance. Higher-dividend-paying stocks also exhibited lower volatility during the secular decline in bond yields. During the five-year period ending in 2015, high-dividend payers exhibited a 10.0 standard deviation of returns, compared to 14.3 for non-dividend payers.2
Returns of dividend-paying stocks can be influenced by the interest rate environment
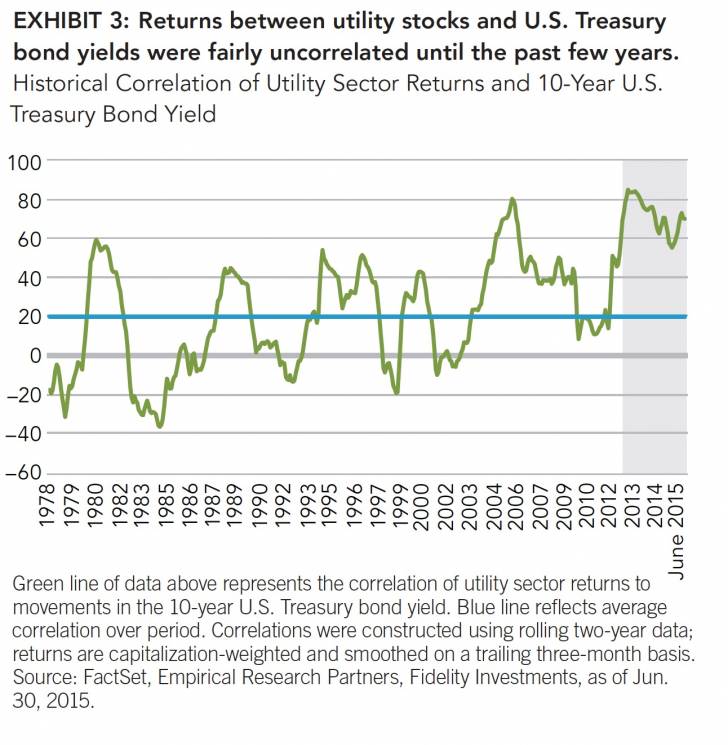
Historically, the fundamental business characteristics of companies, including their cash flow, return on assets, and earnings growth, have had the most significant influence on stock prices over the long term, while macro-oriented factors, such as interest rate movements, have mattered less. One way to observe this is by looking at the correlation of a macro factor, such as interest rate movements, to the performance of stock returns. We evaluated the historical return correlations of high-dividend-paying utilities stocks to U.S. Treasury bond yields. Since the advent of the low-rate environment post the financial crisis, this correlation has become more tightly bound. What was once an unstable and unpredictable correlation between the utility sector and the U.S. Treasury market (Exhibit 3) has now become a stable and very positive correlation during the past five years, representing the impact of falling rates on stock performance.
High-dividend-paying sectors became most sensitive to interest rate movements during past four years
During this recent period of higher return correlations with interest rates, the performance of equity sectors with the highest dividend yields responded most significantly to the direction of interest rates. To illustrate just how powerful interest rate movements were to equity sector interest rates was even more pronounced at the industry returns, we analyzed sector performance in tandem with weekly interest rate changes over the past four years. What we learned is that during this multiyear period of higher correlations when global investors aggressively sought out income wherever it could be sourced, the most bond-like, high-dividend-yielding sectors, namely utilities and consumer staples, outperformed the broader equity market by between 40 and 80 basis points per week on average when rates declined. Conversely, when rates increased, these sectors gave back an almost commensurate 50 to 100 basis points of average relative performance per week (Exhibit 4). Meanwhile, the financials sector meaningfully underperformed when rates declined, and vice versa. Our belief is that this analysis may foreshadow what will come to pass as interest rates eventually rise from their near zero-bound level of the past several years.
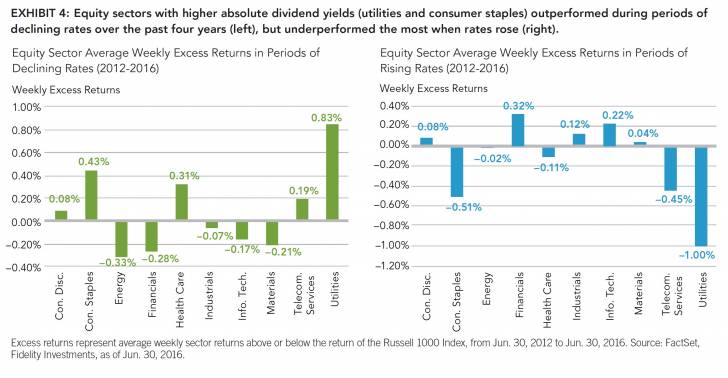
While the absolute excess return numbers in Exhibit 4 don’t appear large, it’s worth keeping in mind that the data represent weekly relative returns compared to the Russell 1000. Additionally, this heightened sensitivity to level, where in many cases we observed even wider disparities in excess returns related to interest rates.
Excess returns varied within the universe of dividend-paying stocks
During this period of higher correlations in the past four years, not all dividend-paying stocks moved in tandem with the direction of interest rates. Market commentary focusing on the impact of interest rates on dividend-paying stocks often takes a “one size fits all” approach, generalizing the perceived impact across all dividend-paying companies. While it’s true that in the aggregate, dividend-yielding equities outperformed non-dividend.paying equities during the recent period of declining and low rates, much of that outperformance was driven by the top two quintiles of dividend yield (Exhibit 5). The most pronounced performance came from the top quintile, which outperformed when rates fell, and vice versa.
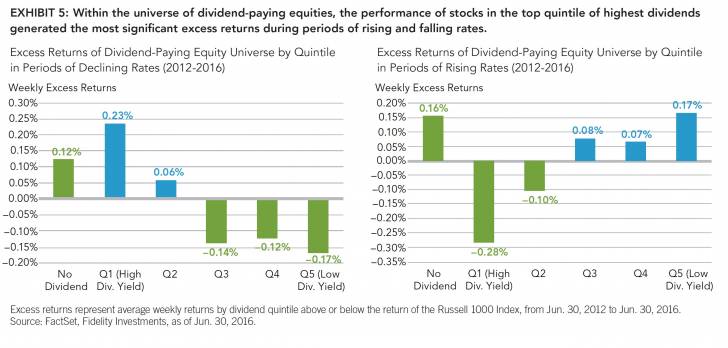
What this analysis shows is that, contrary to popular belief, there are pockets within the dividend-paying equity universe that have outperformed during periods of rising interest rates. The subset of dividend payers that tend to hold up (and even outperform the market) during periods of rising rates are the middle-to-lower-yielding segments of the universe. Not surprisingly, this subset encompasses the companies with payout ratios below approximately 40%—meaning those companies that have some room to grow their dividend and are valued for more fundamental factors beyond just their current income stream.
As rates rise, where should investors source income in the U.S. equity market?
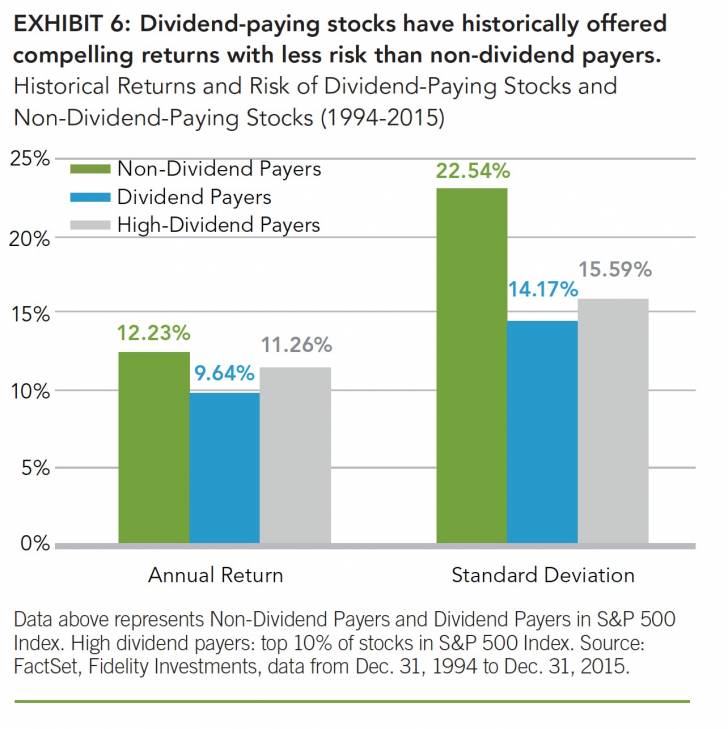
Historically, dividend-paying stocks have provided a compelling return over the long term, with less risk than non-dividend payers (see “The long-term value of dividend-paying stocks,” right). However, as illustrated above, dividend-yielding stocks form a heterogeneous group that defies easy generalizations. In a steadily declining interest rate environment, the penalty for not being discriminating in one’s choice of securities to own was muted—most stocks with higher-dividend yields than the broader equity market outperformed. However, that tailwind of a low and declining interest-rate environment is likely to be less favorable going forward, and may in fact become a headwind. U.S. wage inflation has recently picked up, and growing sentiment suggests the Federal Reserve is likely to raise policy rates.3 The penalties for overpaying for a certain level of dividend income may be amplified going forward, as might be the rewards for thinking forward about which companies can sustain and grow their dividends. The “rising tide lifting all boats” backdrop that existed during the past several years—one where absolute yield was a primary driver of returns—may no longer exist in the coming years.
As the environment gradually retreats from a zero-bound interest rate environment, fundamental factors are likely to matter more. Can a company grow dividends to maintain a positive yield spread relative to potentially rising bond yields? Does the business model behind a dividend payer benefit from or get hurt by rising inflation?
In our view, an actively managed approach that can nimbly move in and out of sectors and securities to source dividend yield from the best-positioned companies is likely to matter more now than it has during the past several years. The corners of the market that appear relatively attractive amid this potentially adjusted backdrop include the financials and industrials sectors (as shown in Exhibit 4) and stocks with lower payout ratios at or below 40%. However, it’s also important to keep in mind that these risks and rewards can shift rapidly, and there is no substitute for a thoughtful, forward-looking approach to constructing dividend-oriented equity portfolios.
The long-term value of dividend-paying stocks
Over extended periods, dividend-oriented equity investing has been a rewarding strategy. In exchange for passing up on the full gain of equities during roaring bull markets, long-term investors have been rewarded with compelling returns, lower levels of volatility, and more income relative to non-dividend payers (Exhibit 6).
Authors
James Morrow, CFA | Portfolio Manager
James Morrow is a portfolio manager for Fidelity Investments. Mr. Morrow manages a number of equity mutual funds for Fidelity.
Naveed Rahman | Institutional Portfolio Manager Naveed Rahman is an institutional portfolio manager at Fidelity Investments. Mr. Rahman co-manages dividend-oriented separately managed accounts, contributes to portfolio construction, publishes research, and represents value and income-oriented equity strategies to institutional clients, prospects, and consultants.
Srinivas Vemparala l Quantitative Analyst Srinivas Vemparala is a quantitative analyst for Fidelity Investments. Mr. Vemparala is responsible for stock selection modeling, risk modeling, portfolio construction research, and managing a separately managed account for equity income strategies.
Fidelity Thought Leadership Vice President Kevin Lavelle provided editorial direction for this article.
For Canadian investors
For Canadian prospects and/or Canadian institutional investors only. Offered in each province of Canada by Fidelity Investments Canada ULC in accordance with applicable securities laws.
Information presented herein is for discussion and illustrative purposes only and is not a recommendation or an offer or solicitation to buy or sell any securities. Views expressed are as of the date indicated, based on the information available at that time, and may change based on market and other conditions. Unless otherwise noted, the opinions provided are those of the authors and not necessarily those of Fidelity Investments or its affiliates. Fidelity does not assume any duty to update any of the information.
Investment decisions should be based on an individual’s own goals, time horizon, and tolerance for risk. Nothing in this content should be considered to be legal or tax advice and you are encouraged to consult your own lawyer, accountant, or other advisor before making any financial decision.
Past performance is no guarantee of future results. It is inherently difficult to make accurate dividend growth forecasts and the outcomes from those forecasts are not guaranteed.
Investing involves risk, including risk of loss.
Stock markets are volatile and can decline significantly in response to adverse issuer, political, regulatory, market, or economic developments. Investing in equities involves risk, including the risk of the loss of principal.
Index or benchmark performance presented in this document does not reflect the deduction of advisory fees, transaction charges, and other expenses, which would reduce performance.
Third-party marks are the property of their respective owners; all other marks are the property of Fidelity Investments Canada.
Endnotes
1 Earnings refers to S&P 500® Utilities GICS-level EBIT (Earnings before interest and taxes) for 2014-2016.
2 Analysis represents annual standard deviation of the highest tercile of dividend compared to non-dividend-paying stocks within the S&P 500 from Dec. 31,
1994 to Dec. 31, 2015, rebalanced monthly.
3 See Fidelity Leadership Series publication “U.S. Economy in Slow Roll Toward Full Late-Cycle Phase (November 2016 Business Cycle Update).”
Definitions
The Russell 1000 Index measures the performance of the largest 1000 U.S. companies in the U.S. equity market.
Top 3000 U.S. Stocks Index represents the top 3000 stocks in the U.S. equity market based on market capitalization.
The S&P 500® Index is a market capitalization-weighted index of 500 common stocks chosen for market size, liquidity, and industry group representation
to represent U.S. equity performance. S&P 500 is a registered service mark of The McGraw-Hill Companies, Inc., and has been licensed for use by Fidelity
Distributors Corporation and its affiliates.
P/E ratio: represents the value of a company based on its current share price divided by its earnings per share.
If receiving this piece through your relationship with Fidelity Institutional Asset ManagementSM (FIAM), this publication may be provided by Fidelity
Investments Institutional Services Company, Inc., Fidelity Institutional Asset Management Trust Company, or FIAM LLC, depending on your relationship.
If receiving this piece through your relationship with Fidelity Personal & Workplace Investing (PWI) or Fidelity Family Office Services (FFOS), this publication
is provided through Fidelity Brokerage Services LLC, Member NYSE, SIPC.
If receiving this piece through your relationship with Fidelity Clearing & Custody SolutionsSM or Fidelity Capital Markets, this publication is for institutional
investor or investment professional use only. Clearing, custody or other brokerage services are provided through National Financial Services LLC or Fidelity
Brokerage Services LLC, Member NYSE, SIPC.
© 2017 Fidelity Investments Canada. All rights reserved.
US: 779368.1.0 CAN: 787895.1.0