
For this week’s edition of the Equity Leaders Weekly we are going examine the US Equity Market with the Dow Jones Industrial Index (DJI.I) finally breaking above the psychological 20,000 barrier. The Dow is the last of the 3 major US stock exchanges to break above a psychological barrier. We are also going to examine how recent hawkish sentiments by the US Federal Reserve has affected the Bond Market of late given increased expectations of further interest rate hikes later into 2017. We will look at the relationship between long term bonds vs. intermediate to short term bonds by using the iShares 20+ Yr. Treasury Bond ETF (TLT) vs the iShares 3-7 Yr. Treasury Bond ETF (IEI).
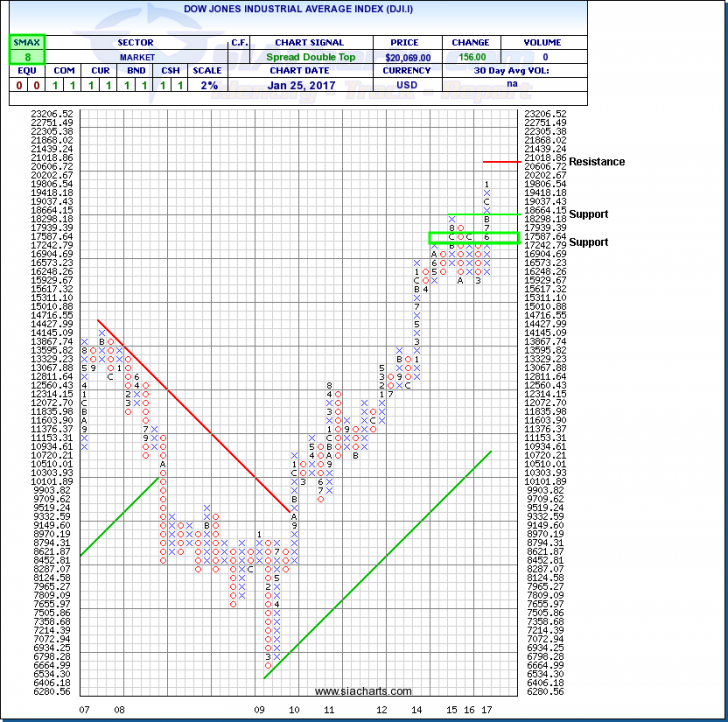
Dow Jones Industrial Average Index (DJI.I)
The markets had exhibited a cautious stance as “The Street” was focused more on Trump’s stand on US protectionism with the talk of border tariffs and the recent announcement the US plans to withdraw from the Trans-Pacific Partnership Agreement. After more than a month of flirting with the barrier the Dow Jones Industrial Index closed above the 20,000 mark for the first time ever yesterday and is now in all time high territory. The markets seem to have sloughed off protectionism concerns and is focusing on the promise of lower taxes and looser regulations which is a boon for the economy. Let looks at the attached chart of the Dow Jones Industrial index (DJI.I) to see what may lie ahead for the index in the coming weeks. Support for the Dow can now be found at 18,298. The next level of support below that, is the 17,242 to 17,587 range. With the Dow in new all-time high territory and past its psychological resistance point, the new level of resistance can be found at the 21,000 area. The Dow currently has a SMAX Score of 8 out of 10 showing near term strength against most asset classes.
Click on Image to Enlarge
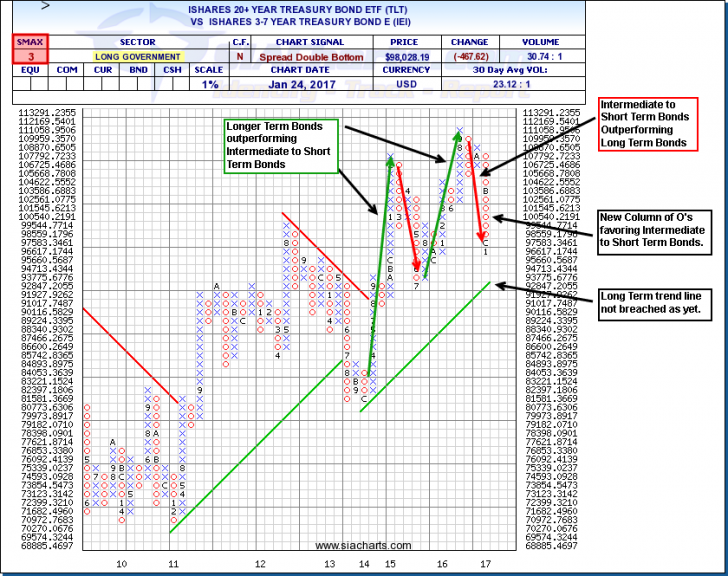
iShares 20+ Yr. Treasury Bond ETF (TLT) vs the iShares 3-7 Yr. Treasury Bond ETF (IEI)
Let’s look at the comparison chart for the iShares 20+ Yr. Treasury Bond ETF (TLT) vs. the iShares 3-7 Yr. Treasury Bond ETF (IEI). This chart can give us insight in the markets appetite for risk in fixed income securities as longer maturities generally have higher risk in a rising interest rate environment. With the Fed indicating they will continue raising interest rates this year, let’s see how the long-term treasury bonds have compared vs. the intermediate to short term treasury bonds. In looking at the attached chart, lets focus on what has been happening in the last few years. In 2014 we see there was relative outperformance of longer term bonds (TLT) vs. intermediate to short term bonds (IEI). In the first half of 2015 we saw a brief reversal where intermediate to short term bonds (IEI) outperformed. From the 2nd half of 2015 to September of 2016 we see that TLT was outperforming IEI. However, leading up to the US election, we can see an interesting reversal begin to take place in October as a new leg of O’s has developed indicating intermediate to short term maturities have outperformed the long-term bonds which signals the markets expectation of a rising interest rate environment. Although the longer-term trend line favoring long term bonds has not been breached yet, we do see most recently, an outperformance in intermediate to short term bonds. It will be interesting to see if this trend continues going forward. With an VS. SMAX of 3 out 10, this potentially indicates further weakness in TLT and perhaps a further move down in the comparison chart which would favor intermediate to short term bonds (IEI).
Click on Image to Enlarge
SIACharts.com specifically represents that it does not give investment advice or advocate the purchase or sale of any security or investment. None of the information contained in this website or document constitutes an offer to sell or the solicitation of an offer to buy any security or other investment or an offer to provide investment services of any kind. Neither SIACharts.com (FundCharts Inc.) nor its third party content providers shall be liable for any errors, inaccuracies or delays in content, or for any actions taken in reliance thereon.
For a more in-depth analysis on the relative strength of the equity markets, bonds, commodities, currencies, etc. or for more information on SIACharts.com, you can contact our sales and customer support at 1-877-668-1332 or at siateam@siacharts.com.
Copyright © SIACharts.com