by Frank Holmes, CIO, CEO, U.S. Global Investors
Share this page with your friends:
Please note: The Frank Talk articles listed below contain historical material. The data provided was current at the time of publication. For current information regarding any of the funds mentioned in these presentations, please visit the appropriate fund performance page.
January 10, 2017
President Calvin Coolidge once said, “The chief business of the American people is business. They are profoundly concerned with producing, buying, selling, investing and prospering in the world.”
True words, indeed. The U.S. has given rise to many of history’s greatest entrepreneurs—from Henry Ford and Walt Disney to Steve Jobs and Jeff Bezos—whose groundbreaking innovations the world can hardly imagine life without. These “mad geniuses” were fortunate enough to live and work in America, where they were free to pursue their larger-than-life dreams and ambitions.

We must ensure the U.S. remains the Land of Opportunity, and sincerely believe that many of President-elect Donald Trump’s policies can help achieve that goal.
Trump has pledged to cut corporate taxes, slash regulations, boost infrastructure spending and repatriate overseas profits—all of which can help foster an industrious biosphere.
It’s also bullish for domestic equities.
Since Election Day, the S&P 500 Index has surged 6.5 percent, and although I’ve seen many headlines proclaiming the so-called Trump rally overdone, I believe there’s still plenty more upside potential. As the saying goes: “Equity bull markets don’t die of old age.”
We’re committed to taking advantage of this upside, which is why we’ve adjusted and dramatically improved the methodology for our two domestic equity funds, the All American Equity Fund (GBTFX) and the Holmes Macro Trends Fund (MEGAX).
Briefly, I want to talk a little about each of the fund’s new methodology to give you a better idea of how they’re set up to capture opportunity in the year ahead and beyond.
All American Equity Fund (GBTFX)
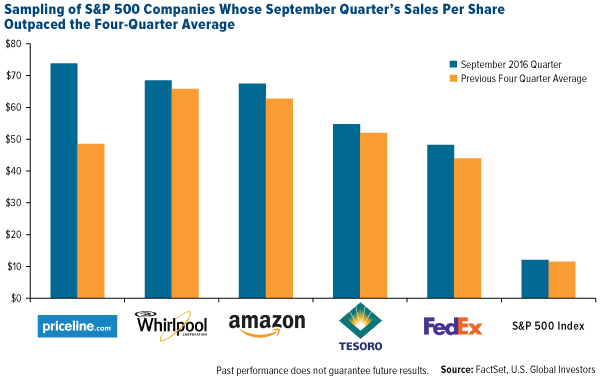
Among other new additions to our methodology, we seek to capture the performance of the “growthiest” companies in the fund’s benchmark, the S&P 500, by focusing on those whose most recent quarter’s sales per share is greater than the average of the previous four quarters. So if a company’s average sales per share for the past four quarters is $30, let’s say, it needs to show something higher than that in the current quarter to be considered.
We want the most active, productive companies on a per-share basis, and we’ve found that sales per share (also known as revenue per share) is one of the best ways to measure this.
To screen for overleveraged firms, we eliminate companies with the highest debt to equity.
We also screen for companies whose cash flow return on invested capital (CFROIC)—one of Warren Buffett’s favorite factors—is above the average for the S&P 500 over the past 12 months.
Holmes Macro Trends Fund (MEGAX)
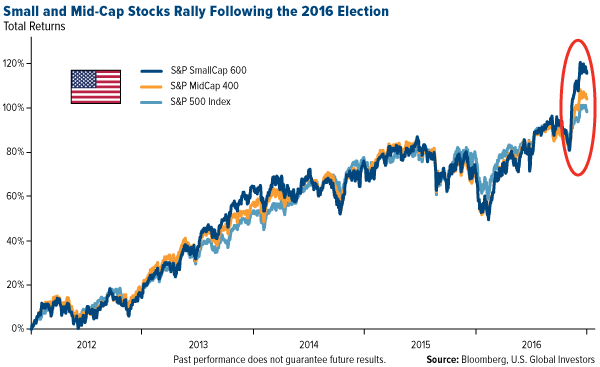
The benchmark for MEGAX is the S&P 1500 Composite Index, which introduces small- and mid-cap stocks to our universe of investable companies. These stocks have been among the best performers since the November election because Trump’s more protectionist policy proposals bode well for companies that have less exposure to overseas markets than large, multinational blue-chip stocks. (The president-elect has threatened to impose a “big border tax” on American goods made overseas and shipped back into the U.S.)
Small- and mid-cap stocks are an exciting place to be right now. As you can see, they’ve rallied dramatically above the S&P 500 since the election, after performing in tandem with blue chips for the past few years.
Mid-cap companies are especially attractive because they’ve reached a point in their enterprise life cycle where the challenges inherent to smaller companies—raising capital early on and managing capacity growth, for example—are mostly behind them. At the same time, they remain dynamic enough for rapid growth to be possible.
That’s why mid-cap stocks account for 40 percent of our new MEGAX model. Meanwhile, 36 percent is in small caps, the remaining 24 percent in large caps.
To screen for the very best companies, we take a similar approach as GBTFX, focusing on those whose sales per share is greater than their average for the past four quarters.
Then, we do some trimming.
We remove the bottom fifth of companies with the lowest growth in the most recent quarter’s return on invested capital (ROIC). We do the same with those that have the lowest gross margins and lowest revenues per employee.
We’re very excited about the changes and have lots of confidence in them going forward. Happy New Year!
Please consider carefully a fund’s investment objectives, risks, charges and expenses. For this and other important information, obtain a fund prospectus by visiting www.usfunds.com or by calling 1-800-US-FUNDS (1-800-873-8637). Read it carefully before investing. Foreside Fund Services, LLC, Distributor. U.S. Global Investors is the investment adviser.
Stock markets can be volatile and share prices can fluctuate in response to sector-related and other risks as described in the fund prospectus.
The Holmes Macro Trends Fund may invest in small- and mid-sized companies, which involve greater risk than investing in more established companies. This risk includes difficulty in obtaining reliable information and financial data and low liquidity in the market, making it difficult to dispose of shares when it may be otherwise advisable.
The S&P 500 Stock Index is a widely recognized capitalization-weighted index of 500 common stock prices in U.S. companies. The S&P SmallCap 600 Index, more commonly known as the S&P 600, is a stock market index from Standard & Poor's. It covers roughly the small-cap range of US stocks, using a capitalization-weighted index. The S&P MidCap 400 Index, more commonly known as the S&P 400, is a stock market index from S&P Dow Jones Indices. The index serves as a barometer for the U.S. mid-cap equities sector and is the most widely followed mid-cap index in existence. The S&P 1500 Composite is a broad-based capitalization-weighted index of 1500 U.S. companies and is comprised of the S&P 400, S&P 500, and the S&P 600. The index was developed with a base value of 100 as of December 30, 1994.
Cash flow return on invested capital is a calculation used to assess a company’s efficiency at allocating the capital under its control to profitable investments. Return on invested capital gives a sense of how well a company is using its money to generate returns.
Fund portfolios are actively managed, and holdings may change daily. Holdings are reported as of the most recent quarter-end. Holdings in the All American Equity Fund and Holmes Macro Trends Fund as a percentage of net assets as of 9/30/2016: Ford Motor Co. 2.05% in All American Equity Fund, The Walt Disney Co. 0.00%, Apple Inc. 0.00%, The Priceline Group 0.00%, Whirlpool Corp 0.00%, Amazon.com Inc. 0.00%, Tesoro Corp. 0.00%, FedEx Corp. 0.00%.
All opinions expressed and data provided are subject to change without notice. Some of these opinions may not be appropriate to every investor.
This post was originally published at Frank Talk.
Copyright © U.S. Global Investors


