
by Jurrien Timmer, Director of Global Macro, Fidelity Global Asset Allocation Division
Key Takeaways
• The “high-vol” presidential candidate has won, and with a sweep of both houses of Congress, the Republicans now have a chance to enact a bold, pro-growth populist agenda.
• This result could be positive for growth, as long as it is not offset by rising protectionism and a more hawkish Federal Reserve (Fed).
• The U.S. economy has reached full employment without emerging from its stagnant growth track, so any acceleration from here will likely be accompanied by higher inflation.
• A return to growth and inflation could give the Fed and other central banks an exit strategy from the era of unsustainable unconventional monetary policy.
The Republican sweep could be good for stocks
Looking at a presidential race strictly through the lens of the financial markets, I have always viewed elections as a choice between a “low-vol” candidate who would maintain the status quo, and a “high-vol” candidate who promises massive change, which would upset the status quo that the other candidate seeks to preserve.
Now, after a stunning upset, the high-vol candidate is our president-elect, and the Republicans swept the House and Senate. As a result of this outcome, many of the claims and promises made during the campaign may actually be implemented, which could be good news for the stock market. Historically, in the year following a Republican sweep of both the White House and Congress, stocks have had a higher return (+8.2%) than in any other election outcome (Democratic sweep, Democratic Congress/Republican President, Democratic President/Republican Congress).1
For now, markets are adjusting to the potential for positive growth and rising inflation that may result from Trump’s promised combination of tax cuts, deficit spending, deregulation, and foreign cash repatriation. The U.S. dollar has rallied sharply, U.S. bellwether stock market indexes have soared to record highs, and the 10-year Treasury yield has risen from 1.7% on election night to 2.3% (Nov 25).2 It has been a massive reflation trade, meaning investors are betting that the world economy will rebound and drive up interest rates and commodity prices. It’s not a cookie cutter reflation trade, though, because emerging-markets stocks have been left in the dust (so far).
With change comes uncertainty, and investors generally want to be compensated for uncertainty through a higher risk premium; e.g., a lower price-to-earnings (P/E) ratio. Uncertainty is what we have for now, as we wait for the president-elect to take office and announce his cabinet and policy speci cs. It doesn’t help that the market is fully valued at around 19 times trailing (past 12 months) earnings and that inflation will likely rise. Thus, any increase in corporate earnings may be partially offset by a compression in P/E multiples.
Two questions loom large as we wait for the new administration to take control. First, to what degree will this pro-growth agenda be offset by increased protectionism (economic policies designed to limit often-unfair foreign competition)? Second, to what extent will the Fed “lean into” the expectation of higher growth by raising interest rates by more than it otherwise would have?
The latter question is critical, because it’s a potential double-edged sword. With the odds of a December interest-rate hike at 95%, it seems almost certain that the Fed will raise rates at its next meeting on Dec. 13–14. But, will the Fed allow the economy to run hot for a while, until it sees the whites of inflation’s eyes? Or will it seek to move pre-emptively and give more hawkish forward guidance for 2017 and beyond? If the former, the U.S. economy may finally reach what we call “escape velocity,” meaning the level of economic activity at which growth becomes self-sustaining (e.g., 3% to 4% GDP growth, adjusted for inflation) without aggressive intervention by the Fed. If the latter, the U.S. dollar could rise too much and lead to a tightening of financial conditions like we experienced earlier this year.
A return to normal for central banks?
One thing that gives me hope is that a return to more robust growth and higher inflation could create a path for central banks to return to conventional monetary policy and, in the process, undo the distortions that have infected financial markets. I have long worried about what the end game might be for all this unconventional monetary policy. Wouldn’t it be great if the central banks were bailed out by growth? A return to growth and inflation could put an end to the “low-vol, high dividend” phenomenon that turned the markets upside down. Also, given that many active managers have under-performed the markets directly as a result of this distorted sector leadership, a return to growth and inflation could mark a return to favor for active management more broadly.
As we’ve seen since the financial crisis, monetary policy reaches its limits when rates decline to the zero lower bound (ZLB). Yes, there is quantitative easing (QE) as a means to create the effects of additional rate cuts, and there’s even negative interest-rate policy (NIRP). But, as central banks around the world have discovered, the bene ts of some unconventional monetary policies are far from clear, while the unintended consequences are very real.
After years of fiscal austerity, it now appears the baton is being passed from monetary policy accommodation to fiscal policy stimulus. Just in time, too. It’s ironic that the Fed has been talking about the day when the economy would finally get out of its funk of 1% to 2% real growth and reach escape velocity. It hasn’t happened so far, but that didn’t prevent the unemployment rate from falling from 10% in 2009 to 4.9% today.3
In other words, the U.S. economy has reached “full employment” (i.e., the limit of how fast the economy can grow without creating inflation) without ever accelerating out of its stagnant growth track. Now, just when the economy has reached its inflation threshold, we may finally get the escape velocity that’s been missing. But it is happening at a time of full employment, so when escape velocity meets full employment, it is likely that inflation will follow.
This is why it seems very likely that a positive growth shock will be accompanied by rising inflation. This suggests potentially better earnings growth, but the resulting price gains may be at least partially offset by a decline in P/E multiples. And history shows that the market’s P/E ratio is inversely correlated to the inflation rate (higher inflation leads to lower P/Es and vice versa).
Potential investment regime scenarios
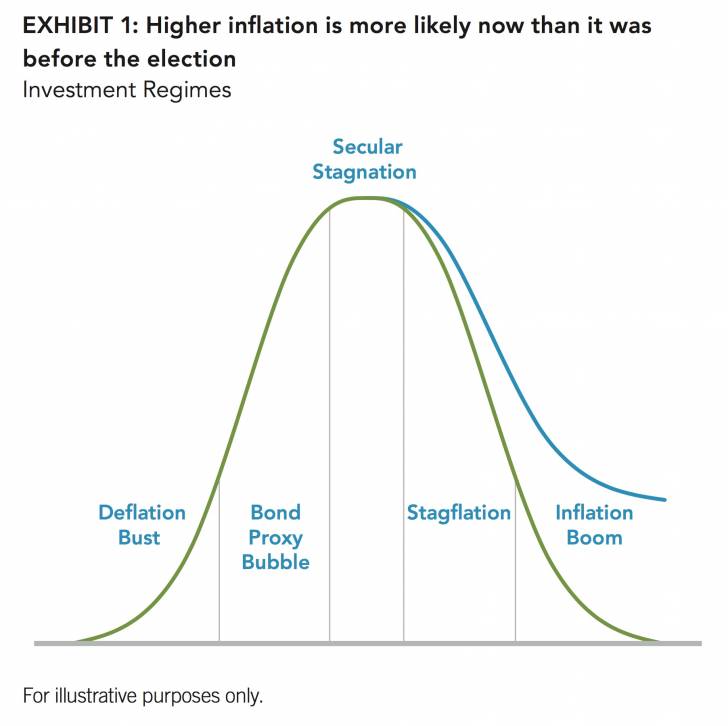
I’ve spoken in the past about which investment regimes are more or less likely to occur, and I’ve used a bell-shaped distribution curve as an illustration. Prior to the election, it seemed we’d be stuck in the current secular stagnation regime for the foreseeable future (the middle of the bell curve in Exhibit 1). It was a “grind-higher” market in which interest rates would remain low to offset weak earnings growth. I perceived that a left-tail event (deflation bust) and a right-tail event (inflation boom) were very unlikely, and that if we had any kind of regime shift it would be either toward stagflation (as the economy reaches its inflation threshold without reaching escape velocity), or a bond bubble (as the effects of increasingly unconventional monetary policy caused more and more disruptions in every asset class around the world).
Now, with a pro-growth administration taking shape, I need to rethink that bell curve. The left tail is still small, but with rates resetting higher the bond bubble scenario now seems less likely than before. Meanwhile, the right-tail scenario of an inflation boom (or boom-let) is not so easily dismissed any more. And that could be a good thing for investors in stocks.
*****
Authors
Jurrien Timmer | Director of Global Macro, Fidelity Global Asset Allocation Division
Jurrien Timmer is the director of Global Macro for the Global Asset Allocation Division of Fidelity Investments, specializing in global macro strategy and tactical asset allocation. He joined Fidelity in 1995 as a technical research analyst.
Fidelity Thought Leadership Vice President Matt Bennett provided editorial direction for this article.
Read/Download the complete report below:
From Low Volatility to High Growth by dpbasic on Scribd
For Canadian investors
For Canadian prospects and/or Canadian institutional investors only. Offered in each province of Canada by Fidelity Investments Canada ULC in accordance with applicable securities laws.
Information presented herein is for discussion and illustrative purposes only and is not a recommendation or an offer or solicitation to buy or sell any securities. Views expressed are as of the date indicated, based on the information available at that time, and may change based on market and other conditions. Unless otherwise noted, the opinions provided are those of the author and not necessarily those of Fidelity Investments or its affiliates. Fidelity does not assume any duty to update any of the information.
Investment decisions should be based on an individual’s own goals, time horizon, and tolerance for risk. Nothing in this content should be considered to be legal or tax advice and you are encouraged to consult your own lawyer, accountant, or other advisor before making any financial decision.
Stock markets are volatile and can fluctuate significantly in response to company, industry, political, regulatory, market, or economic developments. Investing in stock involves risks, including the loss of principal.
Investing involves risk, including risk of loss.
Past performance is no guarantee of future results.
Diversification and asset allocation do not ensure a profit or guarantee against loss. All indices are unmanaged. You cannot invest directly in an index.
1 Dow Jones data, Haver Analytics, Fidelity Investments, as of Nov. 18, 2016.
2 Bloomberg Finance L.P., as of Nov. 21, 2016.
3 Bureau of Labor Statistics, as of Nov. 4, 2016.
Index definitions
Standard & Poor’s 500 (S&P 500®) Index is a market capitalization-weighted index of 500 common stocks chosen for market size, liquidity, and industry group representation to represent U.S. equity performance. S&P 500 is a registered service mark of The McGraw-Hill Companies, Inc., and has been licensed for use by Fidelity Distributors Corporation and its affiliates.
Third-party marks are the property of their respective owners; all other marks are the property of Fidelity Investments Canada.
If receiving this piece through your relationship with Fidelity Institutional Asset ManagementSM (FIAM), this publication may be provided by Fidelity Investments Institutional Services Company, Inc., Fidelity Institutional Asset Management Trust Company, or FIAM LLC, depending on your relationship.
If receiving this piece through your relationship with Fidelity Personal & Workplace Investing (PWI) or Fidelity Family Of ce Services (FFOS), this publication is provided through Fidelity Brokerage Services LLC, Member NYSE, SIPC.
If receiving this piece through your relationship with Fidelity Clearing and Custody Solutions or Fidelity Capital Markets, this publication is for institutional investor or investment professional use only. Clearing, custody or other brokerage services are provided through National Financial Services LLC or Fidelity Brokerage Services LLC, Member NYSE, SIPC.