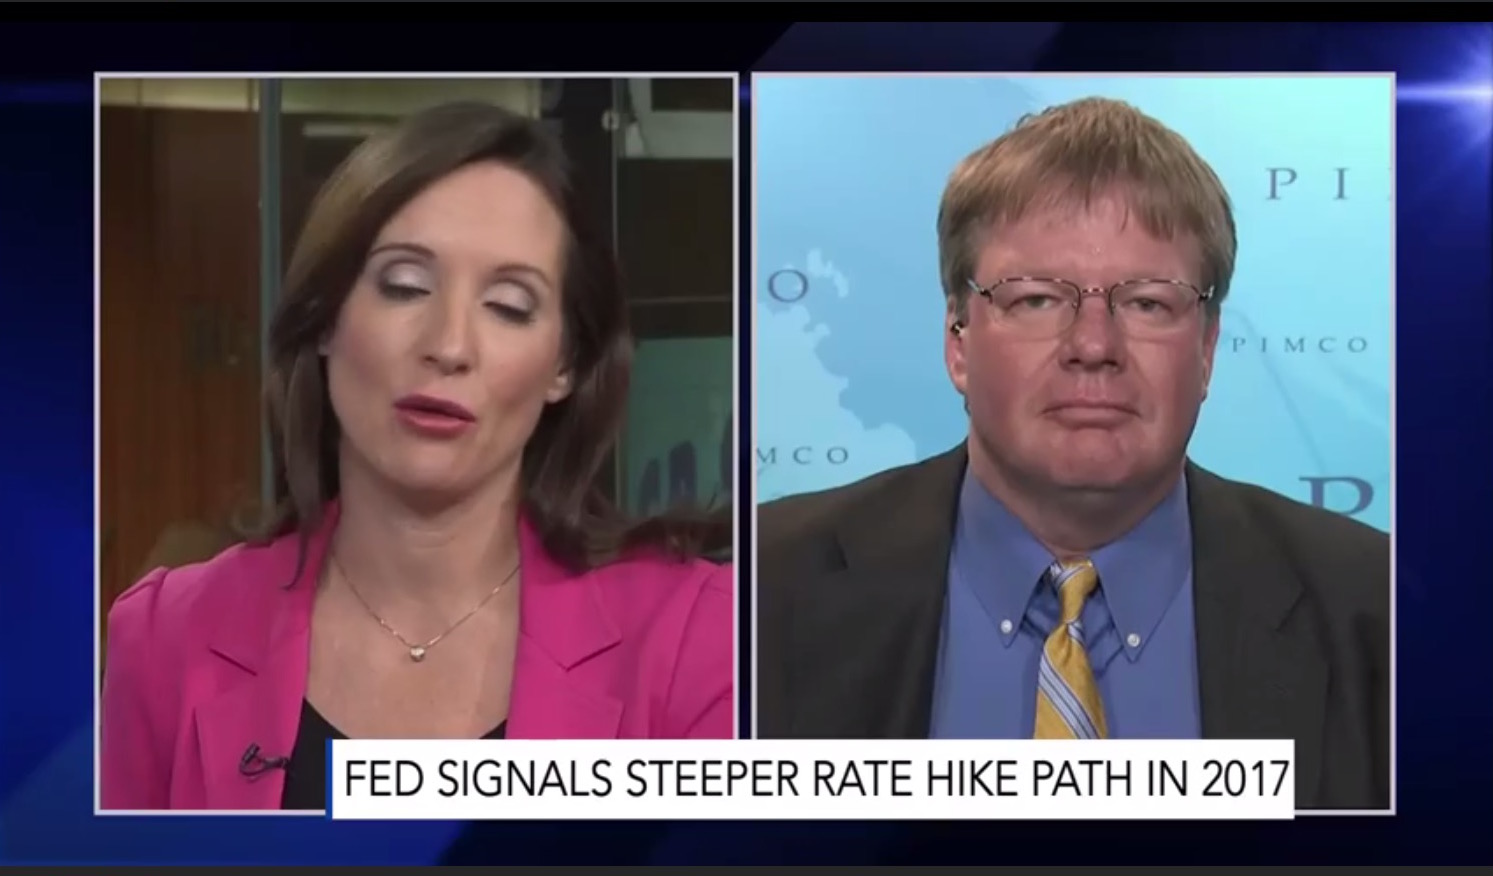
Well the day has finally come. Approximately 1 year ago the US Federal Reserve, after raising the benchmark interest rate in their December 2015 meeting and leading us to believe we could expect 4 further hikes through 2016, they have finally chose to again raise interest rates 25 basis points in their first move this year.
The markets as a whole have been rallying since the US election with major indexes pressing to all-time highs of late. Some of that rally cooled off on Wednesday after the news on the US interest rate hike as well as US Fed Chair, Janet Yellen, said that we can expect further tightening to come in 2017. Most major commodities also closed on a negative note.
Today in the Equity Leaders Weekly we will revisit the USDCAD as well as give an update on Natural Gas through the NG.F continuous contract.
United States Dollar/Canadian Dollar (USDCAD)
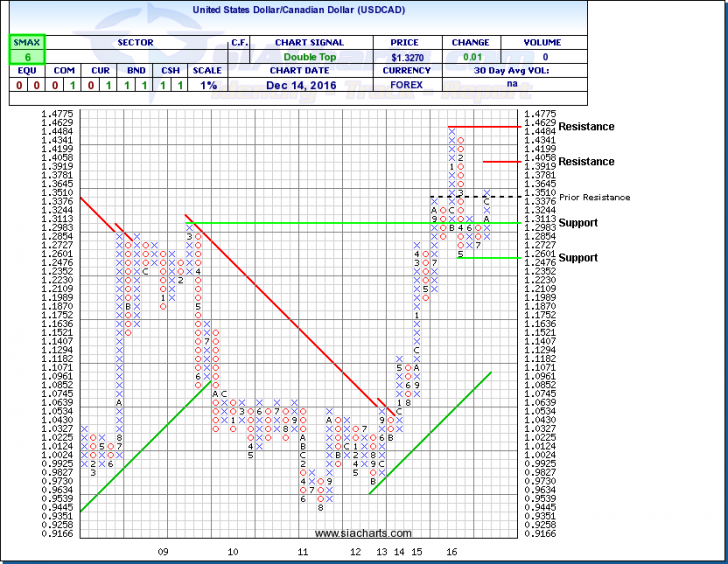
Since last looking at the USDCAD chart on October 27, 2016 in the Equity Leaders Weekly, the greenback has continued in its column of x’s and was able to push through some key resistance at $1.35 to move the chart one box above this level. Since then the USDCAD has had a slight pull back from these highs, however, not enough to form a column of O’s. The recent run in oil as a result of OPEC and non-OPEC production cut agreements had provided some shorter-term strength for the CAD however with the Fed’s decision to raise their baseline interest rate targets in the FOMC meeting yesterday, we are seeing a slight retracement in oil as well as other commodities. The interest rate move is also providing strength for the USD which closed at $1.3270 after Wednesday’s trading.
In looking at the USDCAD chart we can see the prior resistance level that was broken with the USDCAD move above $1.35. Should the USDCAD continue in this column of X’s the next resistance level may come in around $1.40 and above this around $1.45 where we saw the USD move to the last time the Federal Reserve raised their target rate. Support for the USDCAD comes in at approximately $1.30 and $1.25. USDCAD is showing an SMAX of 6, indicating some near term relative strength.
It is unknown now how much of an effect the interest rate hike in the US will affect the USDCAD relationship. The strength may continue as it did at the beginning of the year, or these actions may already be priced into the currency today with less room to move. Interest rate policy in both the US and Canada will be important to the moves associated with this currency pair in the future.
Click on Image to Enlarge

Natural Gas Continuous Contract (NG.F)
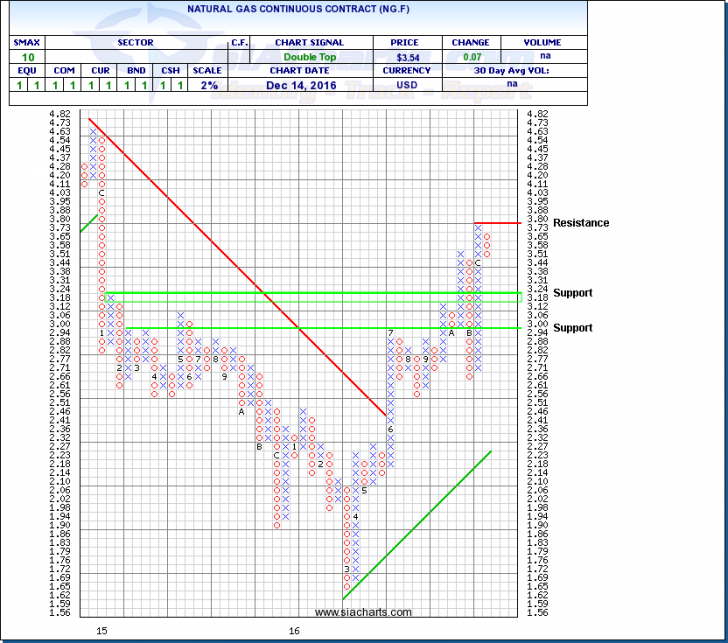
Next we will take a look at the Natural Gas Continuous Contract via NG.F. While often we notice that commodity prices move inverse to the US dollar and most major commodities closed in the red on Wednesday due to USD strength, NG.F was one of the few to close in the green, up ~2.5% to close at $3.54.
The last time we spoke on Natural Gas was on November 3, 2016 where the commodity was sitting at $2.79, pulling back from the highs around $3.50 in October. In November NG.F posted a solid rebound, pushing above October highs and running into resistance at $3.80. There is support for NG.F at $3.12-$3.18 and below this around $3.00. The winter season generally puts support on NG.F prices with higher demand due to heating requirements. Possible strength in the commodity recently could be in part due to the cold temperatures being experienced across North America.
For a more in-depth analysis on the relative strength of the equity markets, bonds, commodities, currencies, etc. or for more information on SIACharts.com, you can contact our customer support at 1-877-668-1332 or at siateam@siacharts.com.
Click on Image to Enlarge

SIACharts.com specifically represents that it does not give investment advice or advocate the purchase or sale of any security or investment. None of the information contained in this website or document constitutes an offer to sell or the solicitation of an offer to buy any security or other investment or an offer to provide investment services of any kind. Neither SIACharts.com (FundCharts Inc.) nor its third party content providers shall be liable for any errors, inaccuracies or delays in content, or for any actions taken in reliance thereon.
Copyright © SIACharts.com


