
by Lance Roberts, Clarity Financial
In this past weekend’s newsletter, I discussed the potential for a breakout by the markets to “all time” highs during a holiday shortened, and light trading, week. On Monday, not to be disappointed, that expectation was met.
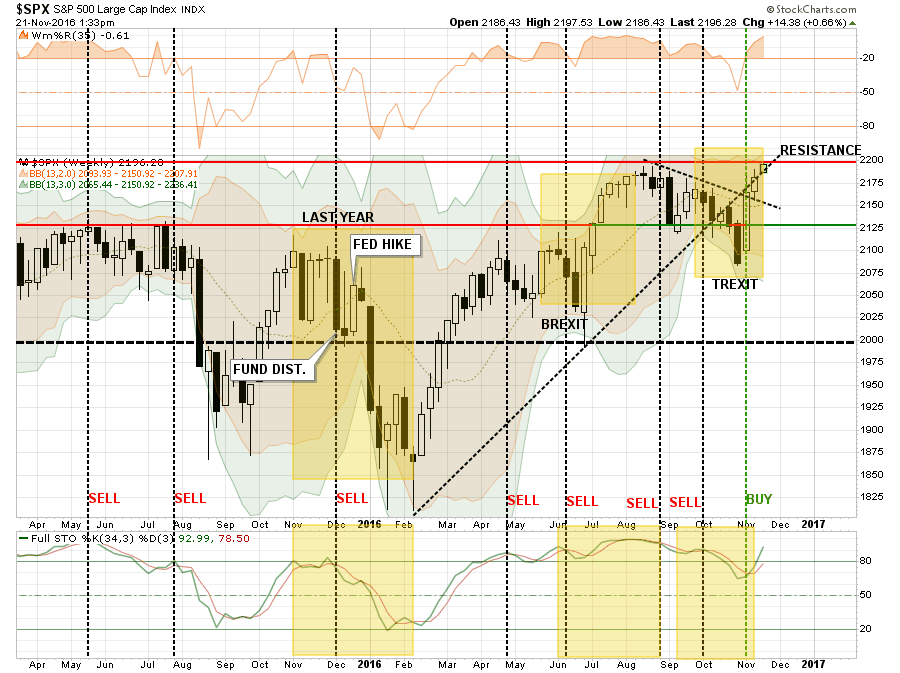
“The good news, as shown in the next chart, is the market was able to clear that downtrend resistance this week and turn the previous “sell signal” back up. As suggested previously, it is not surprising the markets are pushing all-time highs as we saw on Friday.”
But what about after that?
“Importantly, with next week being a light trading week, it would not be surprising to see markets drift higher.
However, expect a decline during the first couple of weeks of December as mutual funds and hedge funds deal with distributions and redemptions. That draw down, as seen in early last December, ran right into the Fed rate hike that set up the sharp January decline.”
As I have noted above, there are many similarities in market action between the “post-Trexit” bounce, “Brexit” and last December’s Fed rate hike. I have highlighted there specific areas of note in the chart above.
“As with ‘Brexit’ this past June, the markets sold off heading into the vote assuming a vote to leave the Eurozone would be a catastrophe. However, as the vote became clear that Britain was voting to leave, global Central Banks leaped into action to push liquidity into the markets to remove the risk of a market meltdown. The same setup was seen as markets plunged on election night and once again liquidity was pushed into the markets to support asset prices forcing a short-squeeze higher.”
So, with that breakout, I am increasing equity risk exposure to portfolios.
However, I am doing so with an offsetting hedge by adding exposure to interest rate sensitive sectors and beaten down opportunities. The reason for those hedges is due to the combined current backdrop of a sharply higher dollar and interest rates which have historically been the ingredients for rather nasty corrections.
The chart below is the 60-day moving average of total 60-day change of both interest rates and the dollar. In other words, I have used a 60-day moving average to smooth out the volatility of the 60-day net change in the dollar and rates so a clearer trend could be revealed. I have then overlaid that moving average with the S&P 500 index.
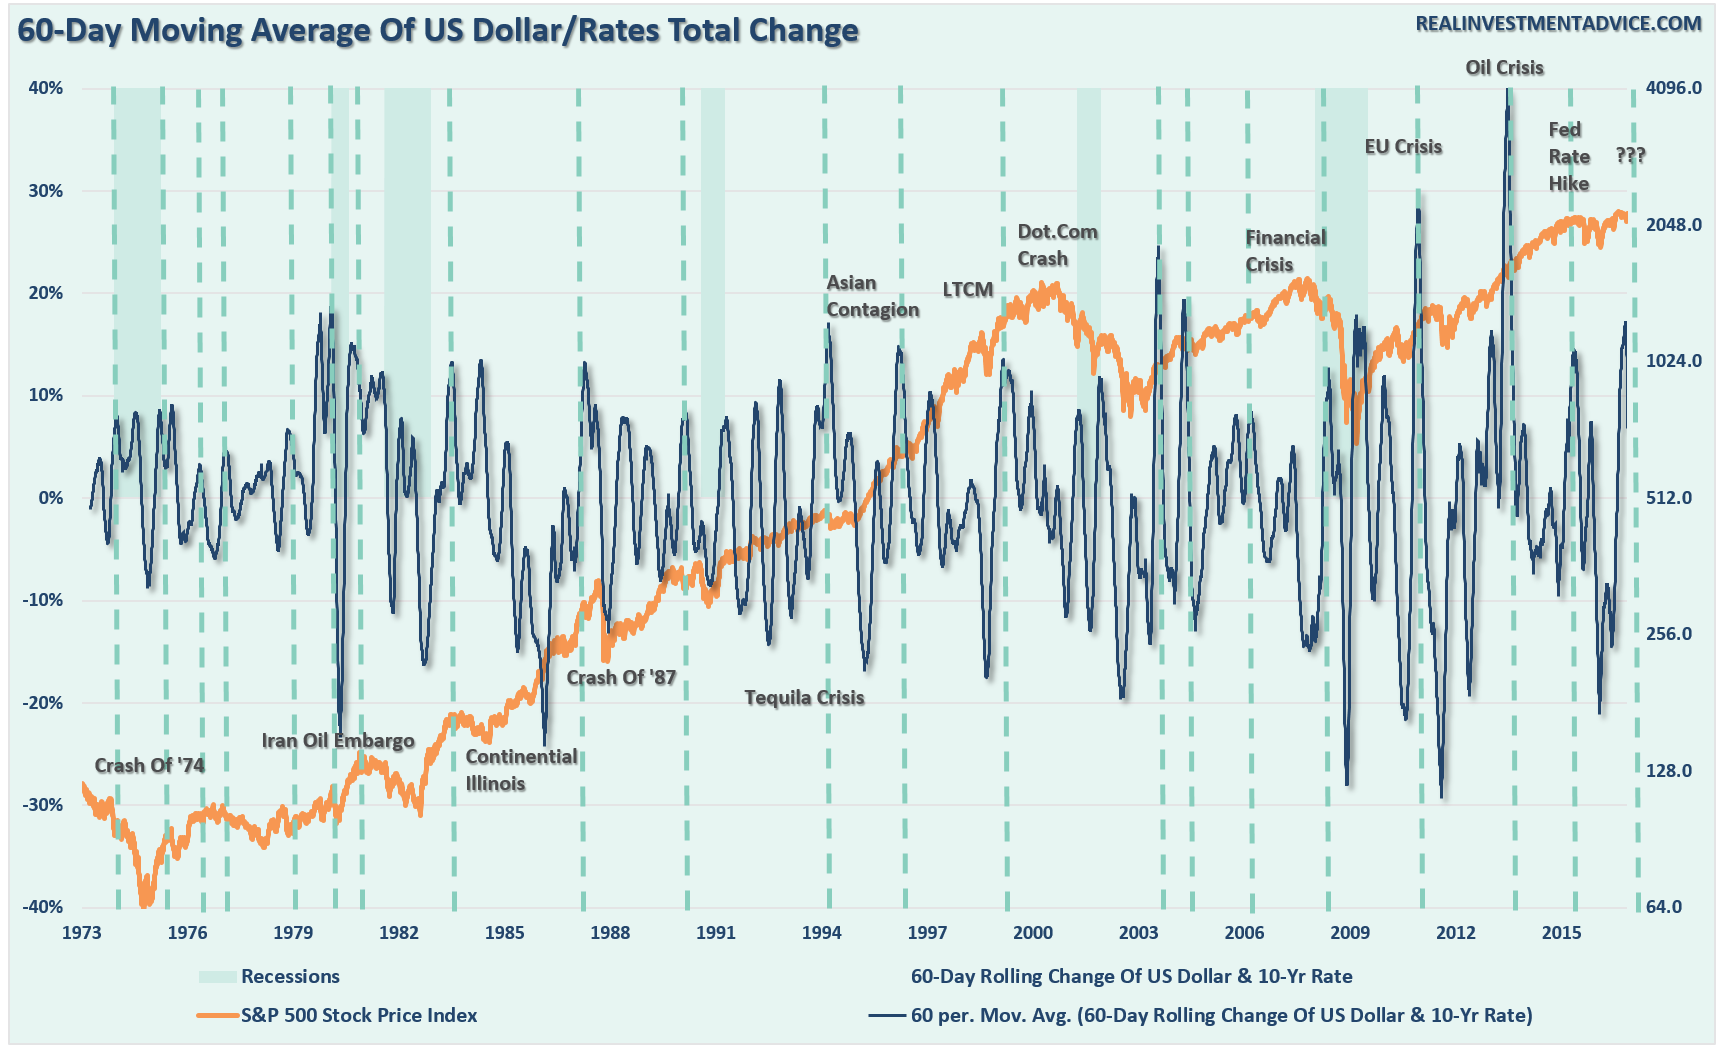
Not surprisingly, since stronger rates negatively impacts economic growth due to increased borrowing costs, and a stronger dollar reduces exports and ultimately corporate earnings, markets tend not to like the combination of two very much.
My analysis agrees with Dr. Lacy Hunt via Hoisington Investment Management who recently stated:
“The recent rise in market interest rates will place downward pressure on the velocity of money (V) and also the rate of growth in the money supply (M). This is not a powerful effect, but it is a negative one. Some additional saving or less spending will occur, thus giving V a push downward. So, in effect, the markets have tightened monetary conditions without the Fed acting. If the Fed raises rates in December, this will place some additional downward pressure on both M and V, and hence on nominal GDP. Thus, the markets have reduced the timeliness and potential success of the coming tax reductions.
Another negative initial condition is that the dollar has risen this year, currently trading close to the 13-year high. The highly relevant Chinese yuan has slumped to a seven-year low. These events will force disinflationary, if not deflationary forces into the US economy. Corporate profits, which had already fallen back to 2011 levels, will be reduced due to several considerations. Pricing power will be reduced, domestic and international market share will be lost and profits of overseas subs will be reduced by currency conversion. Corporate profits on overseas operations will be reduced, but with demand weak and current profits under downward pressure, the repatriated earnings are likely to go into financial rather than physical investment.
Markets have a pronounced tendency to rush to judgment when policy changes occur. When the Obama stimulus of 2009 was announced, the presumption was that it would lead to an inflationary boom. Similarly, the unveiling of QE1 raised expectations of a runaway inflation. Yet, neither happened. The economics are not different now.Under present conditions, it is our judgment that the declining secular trend in Treasury bond yields remains intact.”
While not all combined increases led to major market events/crisis as noted above, more often than not equity participants tended not to fare exceptionally well.
That’s just reality.
Welcome To The “Melt-Up”
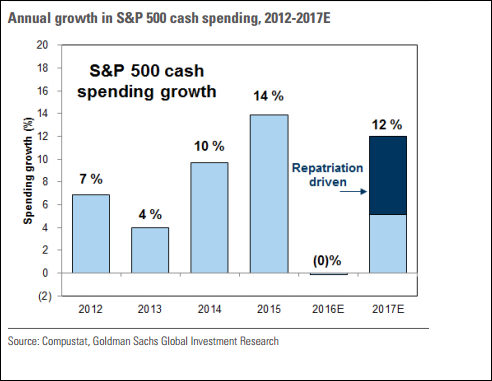
However, while economic and fundamental realities HAVE NOT changed since the election, markets are pricing in expected impacts of changes to fiscal policy expecting a massive boost to earnings from tax rate reductions and repatriated offshore cash to be used directly for stock buybacks.
“We expect tax reform legislation under the Trump administration will encourage firms to repatriate $200 billion of overseas cash next year. A significant portion of returning funds will be directed to buybacks based on the pattern of the tax holiday in 2004.” – Goldman Sachs
But it is not just the repatriation but lower tax rates that will miraculously boost bottom line earnings. This time from Deutsche Bank:
“Every 5pt cut in the US corporate tax rate from 35% boosts S&P EPS by $5. Assuming that the US adopts a new corporate tax rate between 20-30%, we expect S&P EPS of $130-140 in 2017 and $140-150 in 2018. We raise our 2017E S&P EPS to $130.”
See…buy stocks. Right?
Maybe not so fast. Here is the problem.
While you may boost bottom line earnings from tax cuts, the top line revenue cuts caused by higher interest rates, inflationary pressures, and a stronger dollar will exceed the benefits companies receive at the bottom line.
I am not discounting the rush by companies to buy back shares at the greatest clip in the last 20-years to offset the impact to earnings by the reduction in revenues. However, none of the actions above go to solving the two things currently plaguing the economy – real jobs and real wages.
The rush by Wall Street to price in fiscal policy, which may or may not arrive in a timely manner, will likely push the markets higher in the short-term completing the final leg of the current bull market cycle. This was a point I addressed back in October on the potential for a rise to 2400 in the markets. With the breakout of the market to new highs, the bullish spirits have emboldened investors to rush into the most speculative areas of the market.
For now, it is all about the “Trump” trade. Which is interesting considering that just before the election we were all told how horrible a Trump election would be for the world economy.
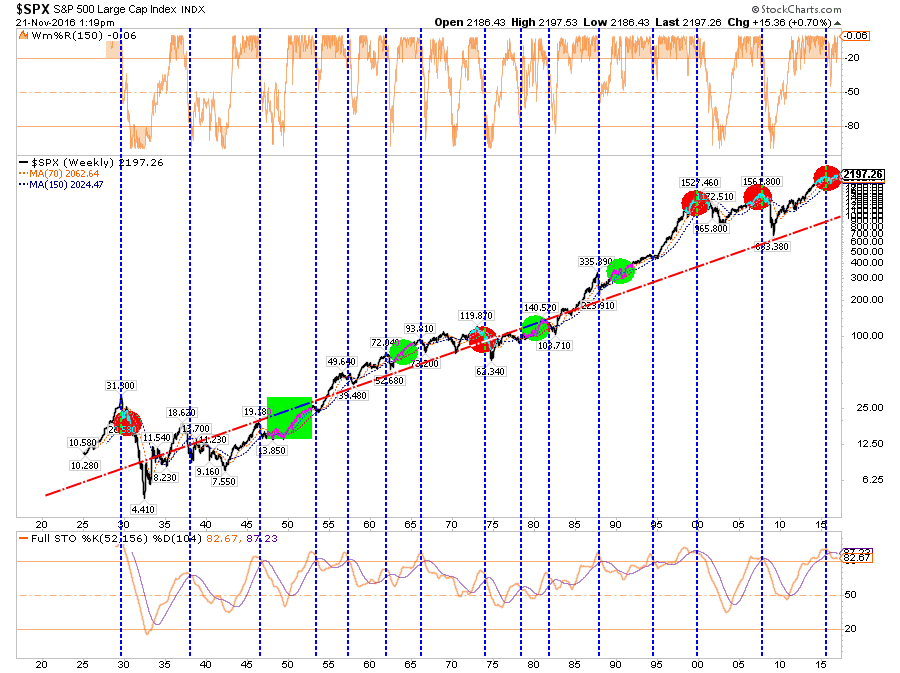
However, it should be noted that despite the “hope” of fiscal support for the markets, longer-term “sell signals” only witnessed during major market topping processes currently remain as shown below.
The problem for the new Administration is the economy is already pushing in excess of 100% of debt-to-GDP which by its very nature reduces the impact of stimulative programs such as infrastructure spending. But the debt itself is also a problem and a point made today by Fed vice chair Fischer issued a clear warning as to the “enormous uncertainty around new US fiscal policies.”
- FISCHER: NOT A LOT OF ROOM TO INCREASE U.S. DEFICIT WITHOUT ADVERSE CONSEQUENCES DOWN THE ROAD
But that is a story for another day.
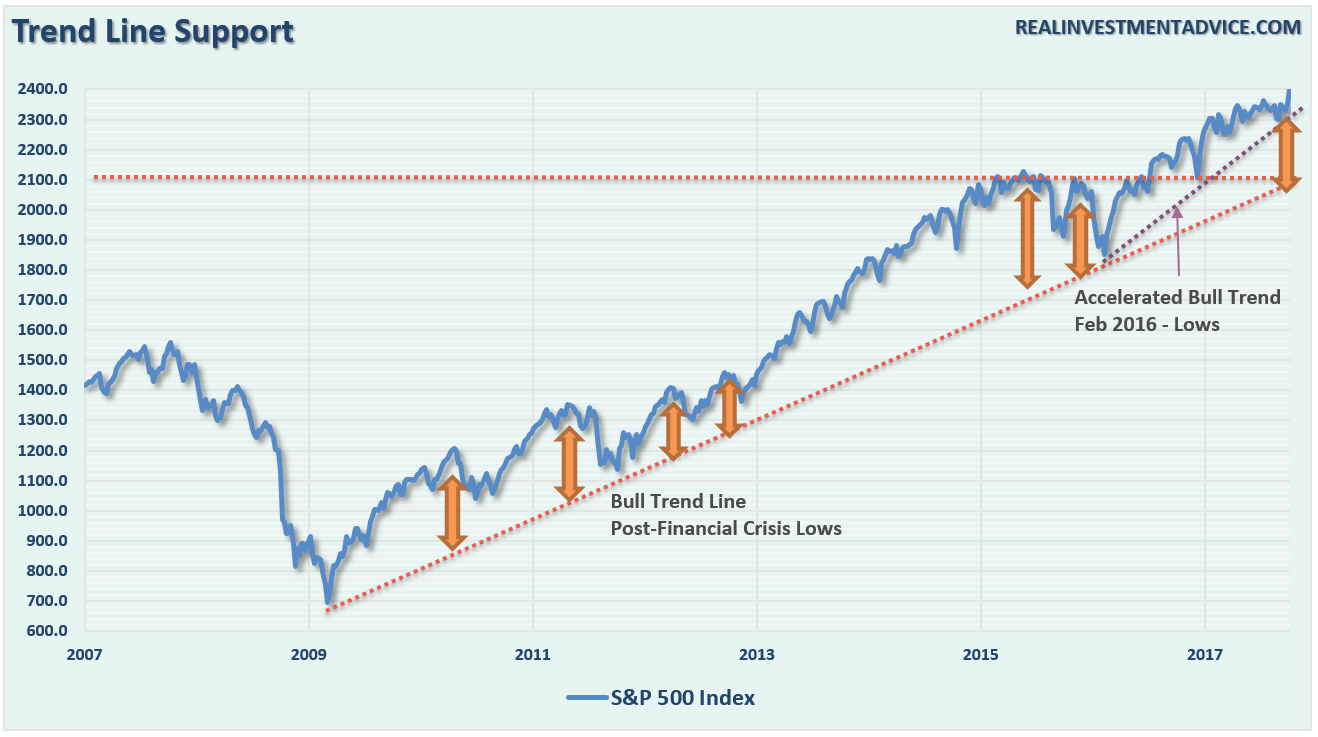
For now, the market is ignoring such realities in the “hope” this time is different. The market has regained its running bullish trend line for now which keeps the “bulls” in charge.
As shown below, the breakout to new highs does clear the markets for a further advance. However, while the technicals suggest a move to 2400, it is quite possible it could be much less. Notice in the bottom section of the chart below. Turning the current “sell signal” back into a “buy signal” at such a high level does not give the markets a tremendous amount of runway.

Furthermore, the market is also pushing into resistance of the previously supportive bullish trend lines. This may limit the upside advance temporarily as the markets work off the currently extreme overbought conditions following the advance from the election lows.

There is also the issue of deviations above the long-term trend line. Trend lines and moving averages are like “gravity.” Prices can only deviate so far from their underlying trends before eventually “reverting to the mean.” However, as we saw in 2013-14, given enough liquidity prices can remain deviated far longer than would normally be expected. (I have extrapolated move to 2400 using weekly price data from the S&P 500.)
A move to 2400 would once again stretch the limits of deviation from the long-term trend line likely leading to a rather nasty reversion shortly thereafter.
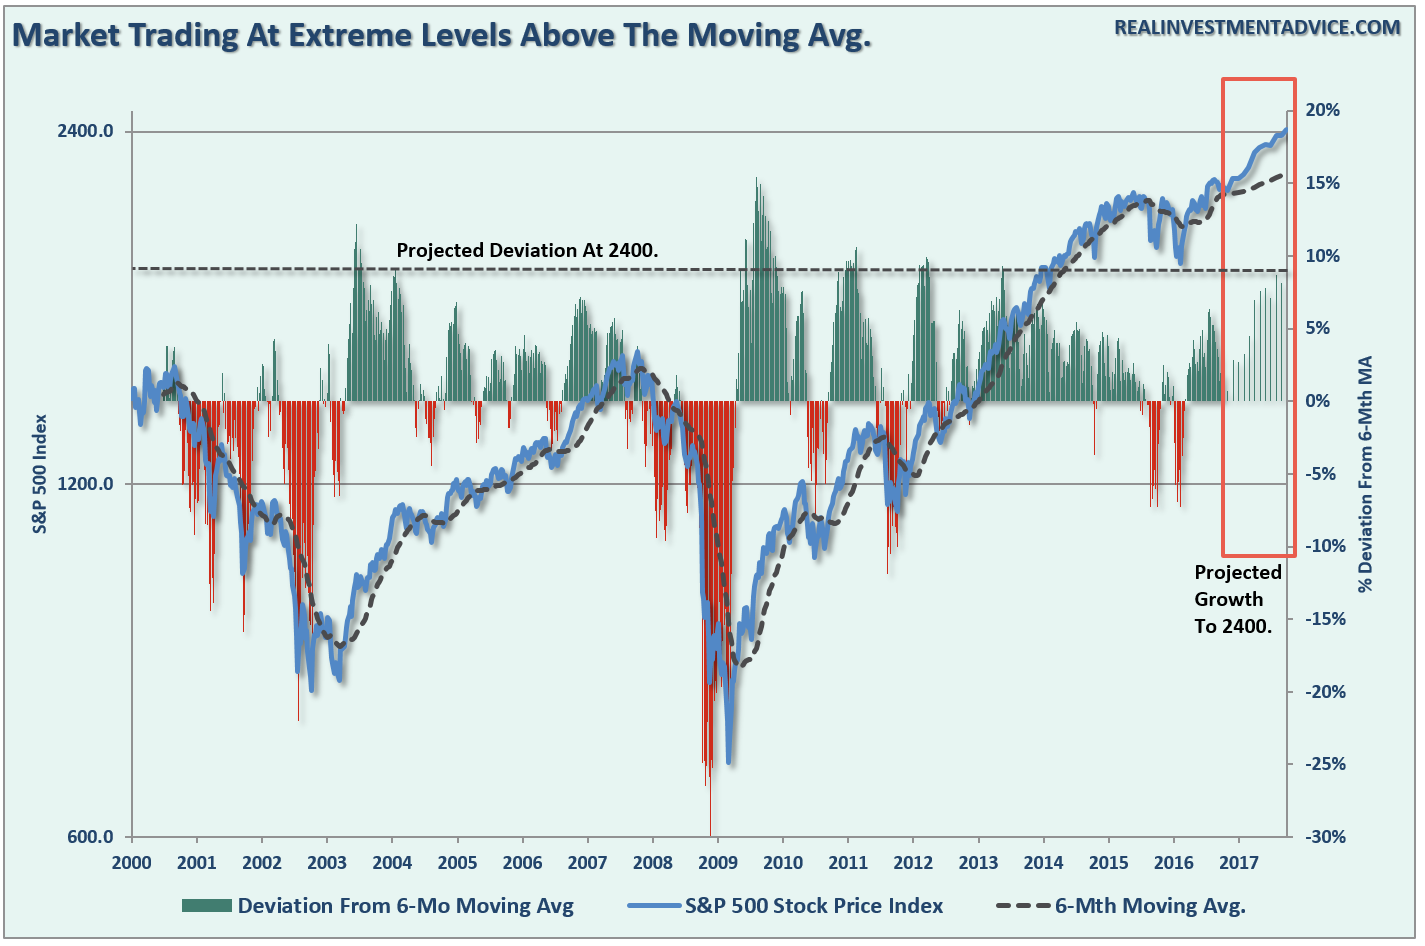
We can see the deviation a little more clearly in the analysis below. Once again, the data in the orange box is an extrapolated price advance using historical market data. The dashed black line is the 6-month moving average (because #BlackLinesMatter) and the bar chart is the deviation of the markets from price average.
Historically speaking deviations of such an extreme rarely last long. As discussed above, while it is conceivable that a breakout of the current consolidation pattern could lead to a sharp price advance, it would likely be the last stage of the bull market advance before the next sizable correction.
This Won’t End Well
As shown in the first chart above, the rising in the dollar and interest rates will lead to an explosion somewhere in the economy and the markets that will negate a good chunk, if not all, of any fiscal policy measures implemented by the next administration.
Where, and when, are the two questions that can not be answered.
How big of a correction could be witnessed? The chart below, once again extrapolated to 2400, shows the mathematical retracement levels based on the Fibonacci sequence. The most likely correction would be back to 2000-ish which would officially enter “bear market” territory of 23.6%. However, most corrections, historically speaking, generally approach the 38.2% correction level. Such a correction would be consistent with a normal recessionary decline and bear market.

Of course, given the length and duration of the current bull-market with extremely weak fundamental underpinnings, leverage, and over-valuations, a 50% correction back towards the 1300 level is certainly NOT out of the question. Let’s not even discuss what would happen if go beyond that, but suffice it to say it wouldn’t be good.
And when it does, the media will ask first “why no saw it coming.” Then they will ask “why YOU didn’t see it coming when it so obvious.”
In the end, being right or wrong has no effect on the media as they are not managing money nor or they held responsible for consistently poor advice. However, being right or wrong has a very big effect on you.
Yes, a move to 2400 is viable, but there must be a sharp improvement in the underlying fundamental and economic backdrop. Right now, there is little evidence of that in the making, and with the rise of the dollar and rates, the Fed tightening monetary policy and real consumption weak there are many headwinds to conquer. Regardless, it will likely be a one-way trip and it should be realized that such a move would be consistent with the final stages of a market melt-up.
As Wile E. Coyote always discovers as he careens off the edge of the cliff, “gravity is a bitch.”
Lance Roberts

Lance Roberts is a Chief Portfolio Strategist/Economist for Clarity Financial. He is also the host of “The Lance Roberts Show” and Chief Editor of the “Real Investment Advice” website and author of “Real Investment Daily” blog and “Real Investment Report“. Follow Lance on Facebook, Twitter and Linked-In
Copyright © Clarity Financial