
by Ben Carlson, A Wealth of Common Sense
Interest rates are a huge driving force behind many investment decisions. You can call them discount rates, hurdle rates, lending rates, borrowing rates or whatever, but their level definitely has an affect on risk appetites.
But I also think it’s possible for investors to put too much faith into the almighty interest rate. For instance, there’s a huge difference between credit and interest rate levels. Rates were much higher in the mid-2000s but credit was much looser so people borrowed like crazy, something they’re not doing as much today.
The relationships between stocks and rates is another interesting one. I’ve seen a number of research pieces in recent years show a graph similar to this one:
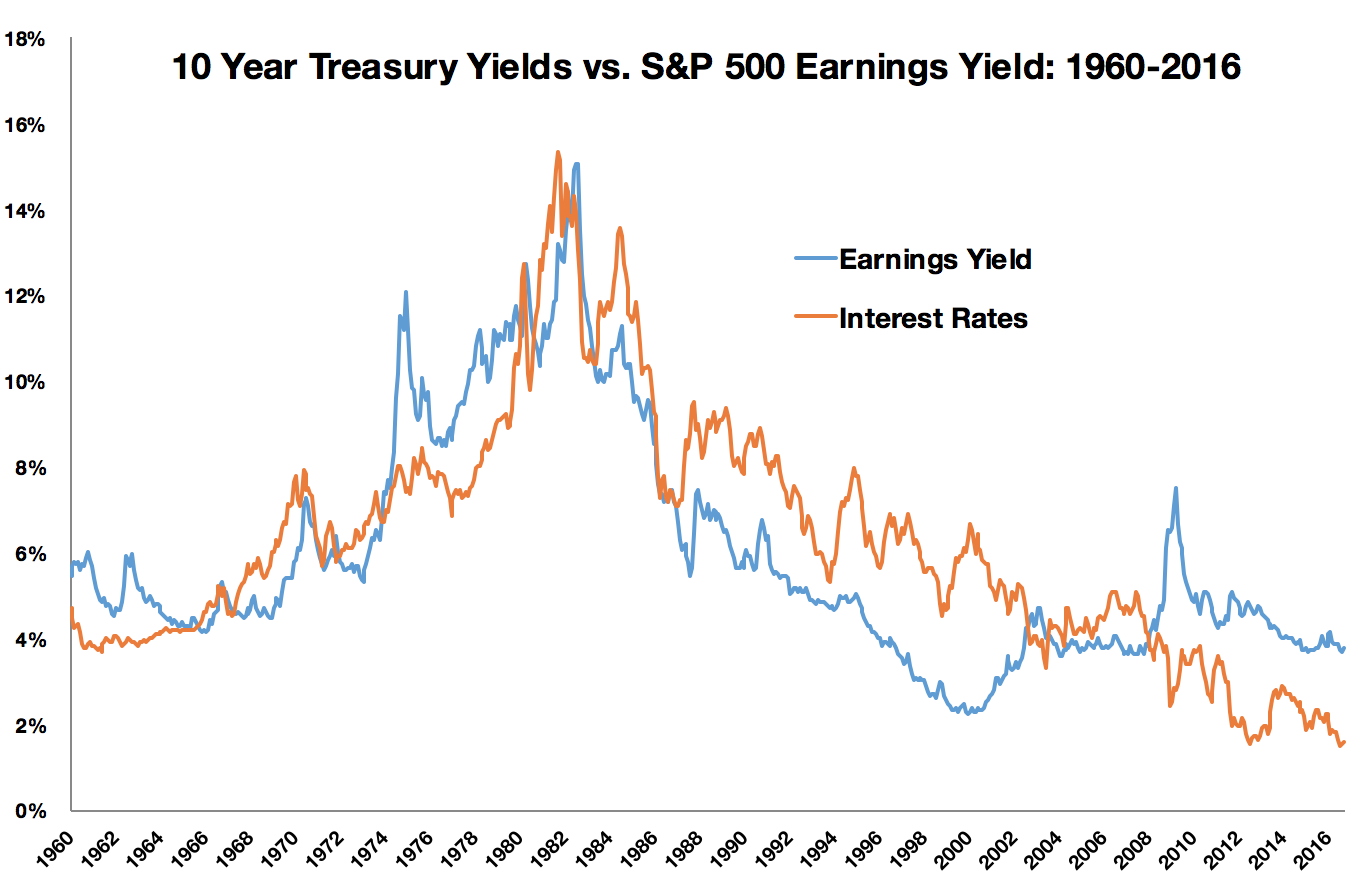
This graph — with help from Robert Shiller’s database — shows the relationship between interest rates (as measured by the 10 year treasury yield) and the stock market earnings yield (as measured by the inverse of the CAPE ratio).
At first glance it does appear that interest rates and stock market yields have had a strong relationship over the past six decades or so. They’ve followed an eerily similar path.
So the obvious conclusion here is that we need higher interest rates to see higher future stock returns, correct?
Well, things are not always quite this easy. If we take this data back before 1960 things played out a little differently:
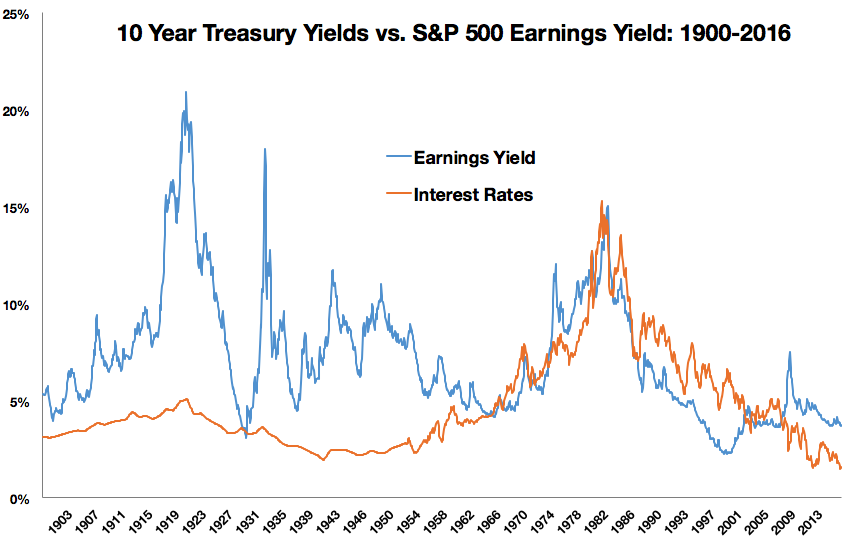
Now it would appear this relationship doesn’t look quite strong anymore.
It’s possible investors have become wiser over the years and figured out the importance of interest rates as it pertains to stock market returns, but there’s still one more check we can run to see if that’s true or not.
Earnings yield is simply a single valuation indicator. It tells us how attractive stocks are based on a single measure — earnings divided by stock prices — but it tells us nothing about what’s actually going to happen. So I took the same data and added in the forward 10 year returns on the S&P 500 to see how well the current earnings yield has done as a predictor of forward 10 year stock market returns:
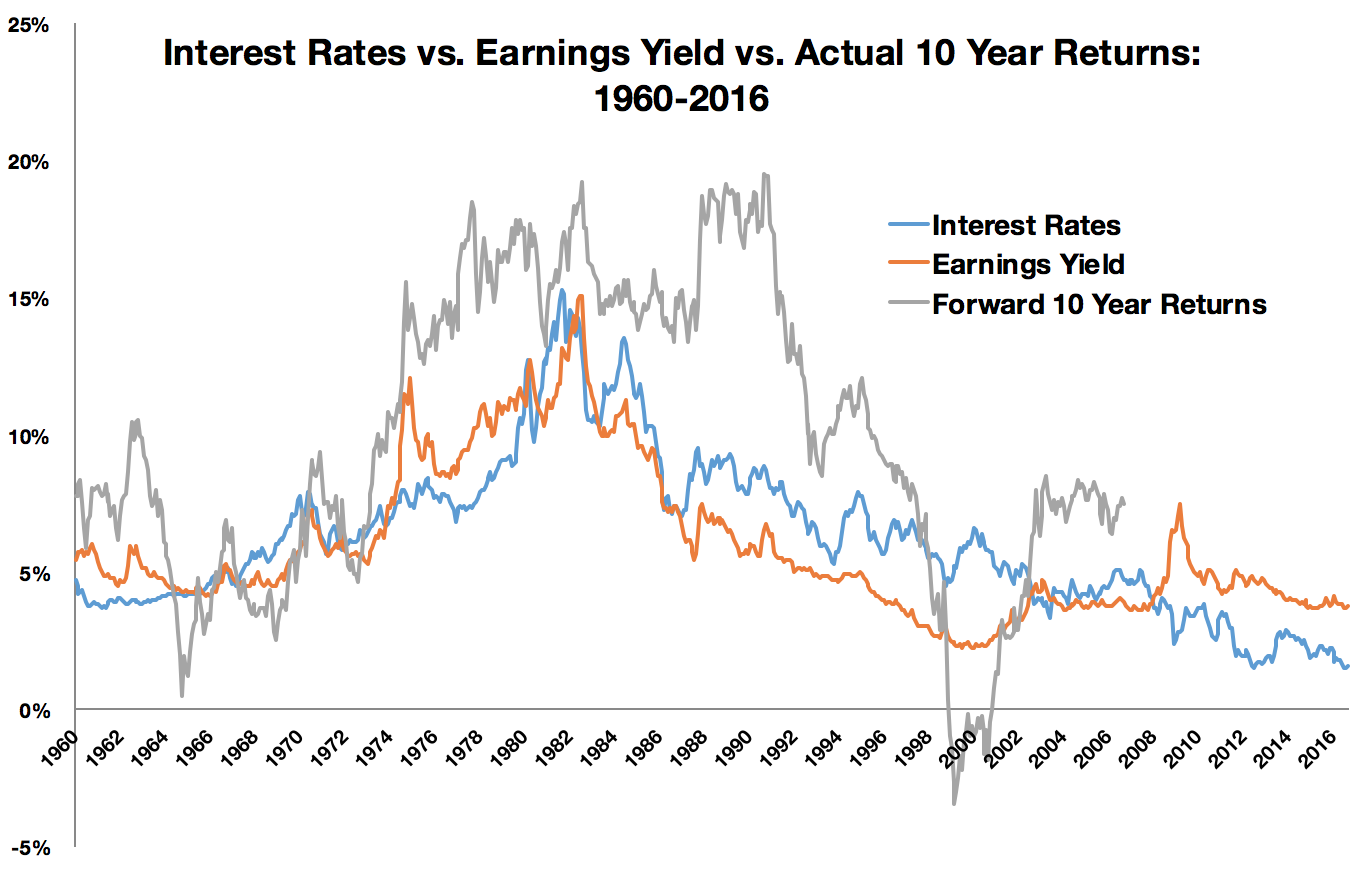
What I did here was take the starting earnings yield and layer on top of it the forward 10 year returns from that point on (which is why that line stops in 2006). This one seems to break this relationship down even further. While the general direction was followed during certain time frames, the actual results have been all over the place in comparison to the starting yields.
The reason here is fairly simple — valuations and interest rates are crude signals, at best. They may give us some general idea about how things should play out, but things rarely play out in the markets as they should.
I guess the point here is that there’s never going to be one or two indicators that will tell you exactly how the future of the markets will unfold. There are certain relationships that don’t quite translate so well from the textbook theory into the real world.
This doesn’t mean that you should ignore these types of signals or theories, but it does make sense to take them all with a grain of salt. Valuations and interest rates can provide some perspective but nothing is ever certain between expected and actual results in markets that have a huge human element involved.
Further Reading:
The Anti-Risk Bubble
Copyright © A Wealth of Common Sense