


by Lance Roberts, Clarity Financial
Last Monday, I discussed why you should be worried about corrections due to the damage inflicted upon your investment capital and the time required to “get back to even.” Not surprisingly, as usual when I discuss such heresy as actually managing your money, I received several emails stating we are in a new “secular bull market” and “indexing” is now the best approach.
It is an interesting point and one that has been prognosticated by several Wall Street analysts in recent months. However, again not surprisingly, I disagree. Let me explain.
A secular market refers to a market trend that persists over decades. The chart below shows the history of secular bull market periods going back to 1871 using data from Dr. Robert Shiller. One thing you will notice is that secular bull markets tend to begin with valuations below 10x earnings and end at 23-25x earnings. (Over the long-term valuations do matter.)

The chart below compares the last secular “bear” market that ran from 1963 to 1982 as compared the current cycle. Notice the chart for this previous period stops in 1973. I will show you the rest of this period in a moment.
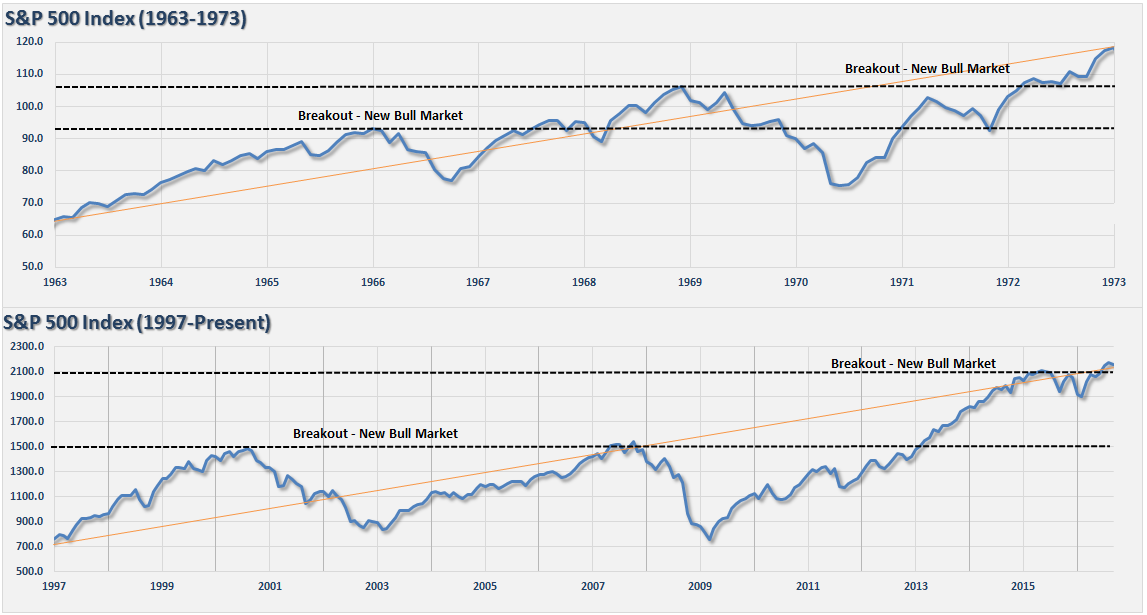
What is important, besides the very similar pattern between the two periods, is the breakout in 1969 did not start a new bull market. It was a setup for the next major decline.
“Okay, but the breakout in 1972 was surely the beginning of the new secular bull market – right?”
Not so fast.
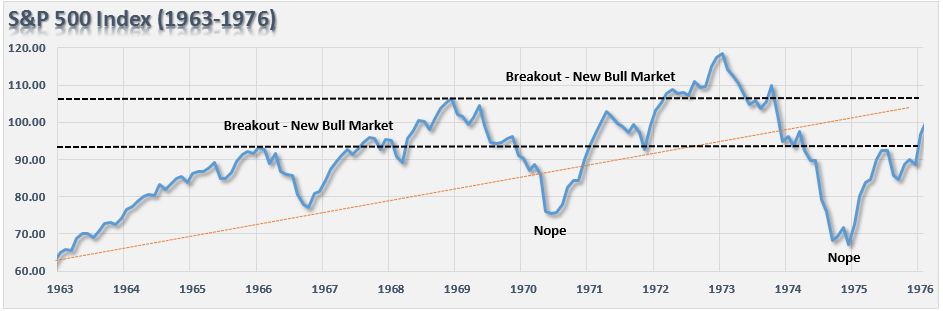
The second breakout in 1972, like the previous, was the setup for the final market dive that reset valuation levels back to historic secular bear market lows. That crash also created the necessary extreme negative in investor psychology. The 1974 bear market low is known as a “black bear market” because investors were so brutally ravaged by the crash they did not return until nearly two decades later.
But it is not just price action that denotes secular bull and bear market periods. Nor is it just cheap valuations.
The ability to have a “1982-2000 affair” is highly improbable. The 1982-2000 secular bull market cycle was driven primarily by a multiple expansion process which began with valuation levels of 5-7x earnings and a dividend yield of 6%. Interest rates and inflation were at extremely high levels and were at the beginning of a 30-year decline which would increase profitability as production and interest rate costs fell.
The first chart shows the secular bear market of the 60’s and 70’s with an overlay of valuations, dividends, interest rates and inflation.
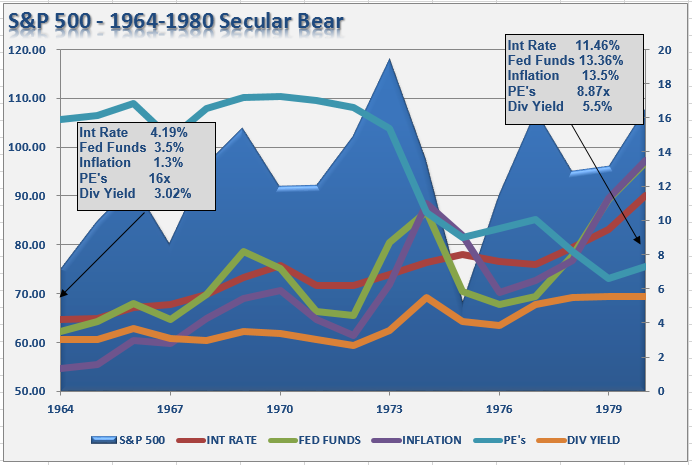
You will notice that at the beginning of the bear market in the 60’s valuations were high while everything else was low. By the end of the secular period, these factors were reversed.
Now, let’s juxtapose that previous period with the much beloved, and hoped for, secular bull market of the 1980’s and 90’s.
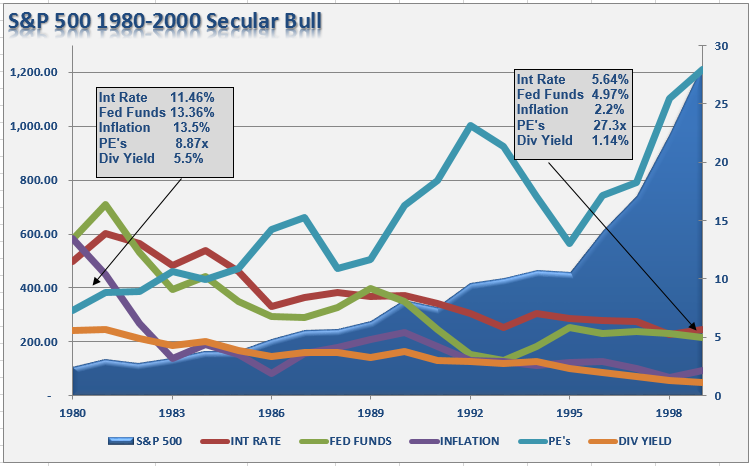
There were several contributing factors that drove that particular secular bull market:
- Inflation and interest rates were high and falling which boosted corporate profitability.
- The extreme negative sentiment of the late 70’s was finally undone by the early 90’s. (At the turn of the century roughly 80% of all individual investors in the market began investing after 1990. 80% of that total started after 1995 due to the investing innovations created by the Internet. The majority of these were “boomers.”)
- Large foreign net inflows to chase the “tech boom” drove prices to extreme levels.
- The mirage of consumer wealth, driven by declining inflation and interest rates and easy access to credit, inflated consumption, corporate profits, and economic growth.
- Corporate profits were boosted by deregulation of industries, wage suppression, outsourcing and productivity increases.
- Pension funding requirements and accounting standards were eased which increased corporate profits.
- Stock-based executive compensation was grossly expanded which led to more “accounting gimmickry” to sustain stock price levels.
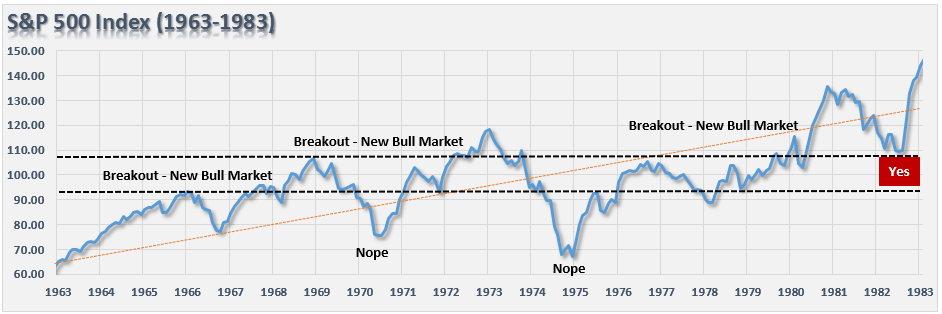
The dual panel chart below shows the economic fundamentals versus the S&P 500 and the change that occurred beginning in 1983. (Red dividing line)
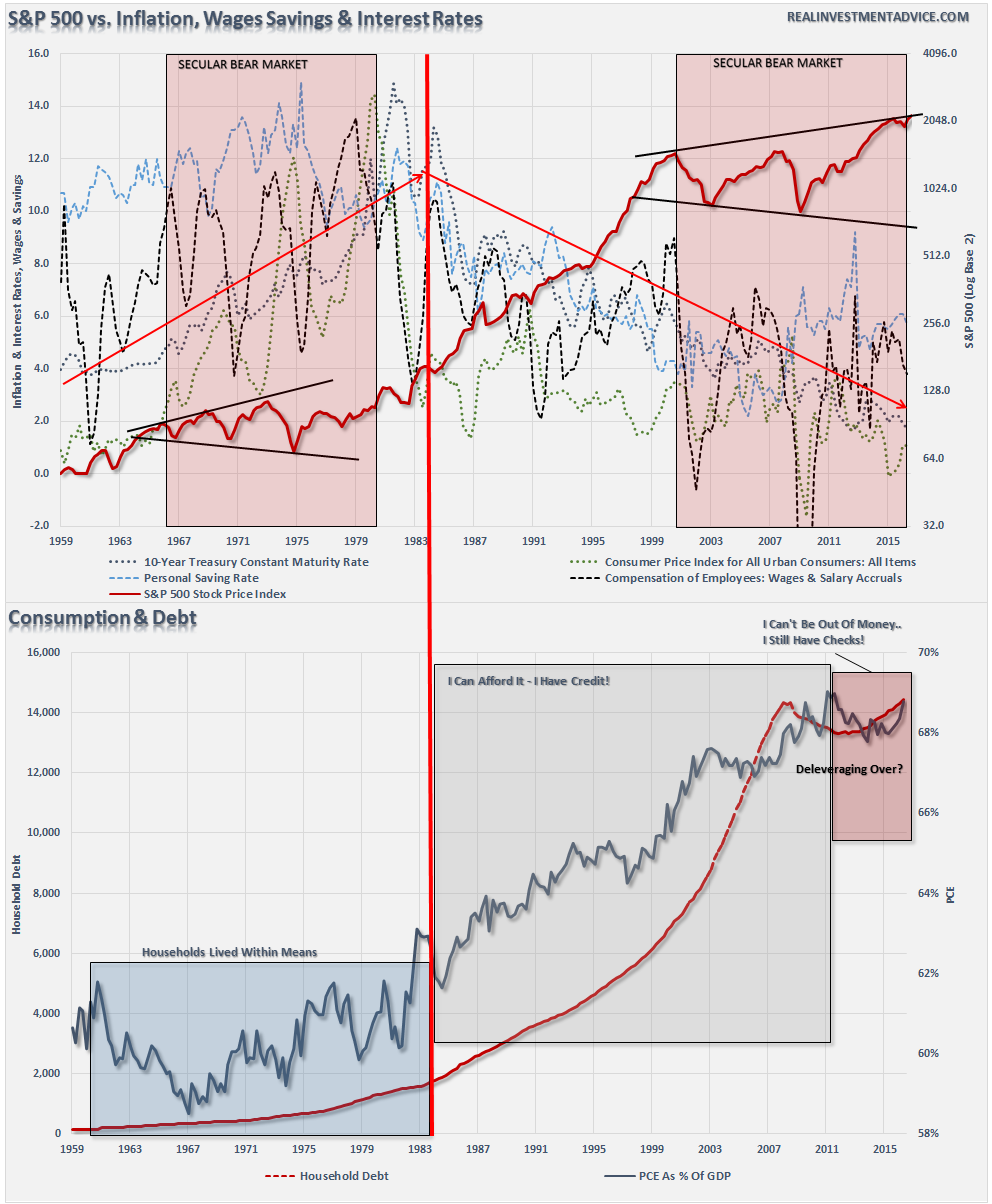
I have also noted the expanding “megaphone” pattern in the current market as compared to that of the 60’s and 70’s.
Despite much hope that the current breakout of the markets is the beginning of a new secular “bull” market – the economic and fundamental variables suggest otherwise. Valuations and sentiment are at very elevated levels which are the opposite of what has been seen previously. Interest rates, inflation, wages and savings rates are all at historically low levels which are normally seen at the end of secular bull market periods, not the beginning of one.
Lastly, the consumer, the main driver of the economy, will not be able to again become a significantly larger chunk of the economy. With savings low, income growth weak and debt back at record levels, the fundamental capacity to releverage to similar extremes is no longer available.
While stock prices can certainly be driven much higher through the Federal Reserve’s ongoing interventions, the inability for the economic variables to “replay the tape” of the 80’s and 90’s increases the potential of a rather nasty mean reversion at some point in the future. It is precisely that reversion that will likely create the “set up” necessary to start the next great secular bull market. However, as was seen at the bottom of the market in 1974, there were few individual investors left to enjoy the beginning of that ride.
Hold on to your hats friends – 2017 could well turn out to be an interesting year for all the wrong reasons.
Lance Roberts

Lance Roberts is a Chief Portfolio Strategist/Economist for Clarity Financial. He is also the host of “The Lance Roberts Show” and Chief Editor of the “Real Investment Advice” website and author of “Real Investment Daily” blog and “Real Investment Report“. Follow Lance on Facebook, Twitter and Linked-In
Copyright © Clarity Financial