by Don Vialoux, Timingthemarket.ca
Another Milestone
Yesterday, another milestone was reached by StockTwits followers who receive EquityClock comments during the market day. Previous milestone was set on July 15th at 26,000 followers. Yesterday, number of followers increased to 27,000.
Observations
Today is triple witching day for U.S. equity markets. Volume and volatility normally is higher than average.
StockTwits Released Yesterday @EquityClock
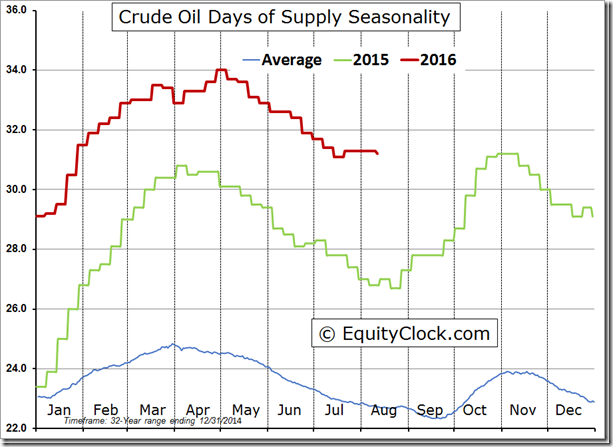
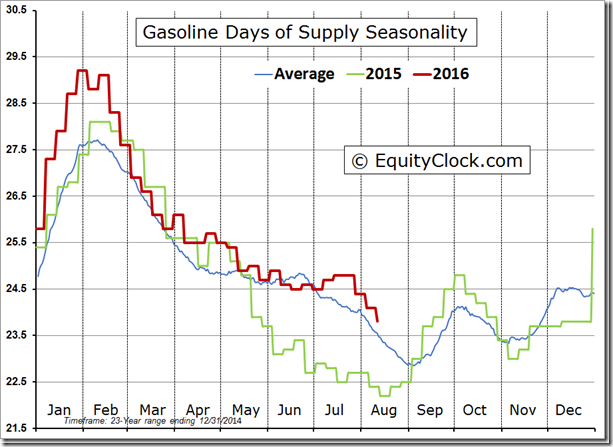
Oil and gas inventories fall despite an uptick in production of each.
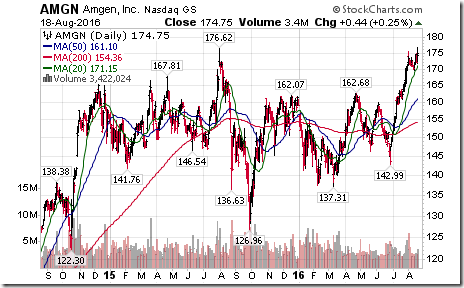
Technical action by S&P 500 stocks to Noon: Bullish. Breakouts: $HBI, $HRL, $FTI, $KMI, $MRO, $HAL, $AMGN, $PCAR, $PWR. No breakdowns.
Editor’s note: After Noon, breakouts included OKE, EL, UNP and QCOM. Breakdown: HOG.
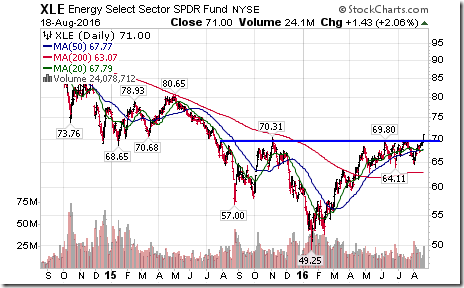
Energy SPDRs $XLE completed a reverse Head & Shoulders pattern on a move above $70.31.
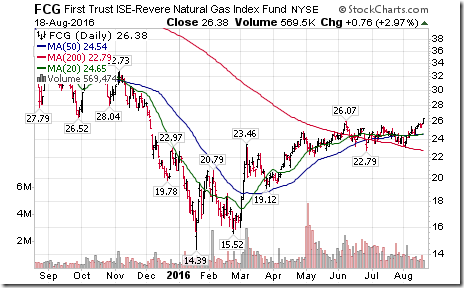
“Gassy” stocks and related ETFs stronger! Nice breakout by $FCG above $26.07 extending uptrend.
Nice breakout by $AMGN above $176.62 reaching all-time high extending intermediate uptrend.
Trader’s Corner
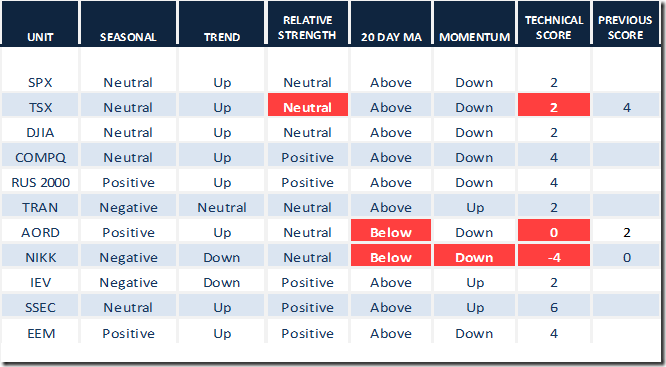
Daily Seasonal/Technical Equity Trends for August 18th 2016
Green: Increase from previous day
Red: Decrease from previous day
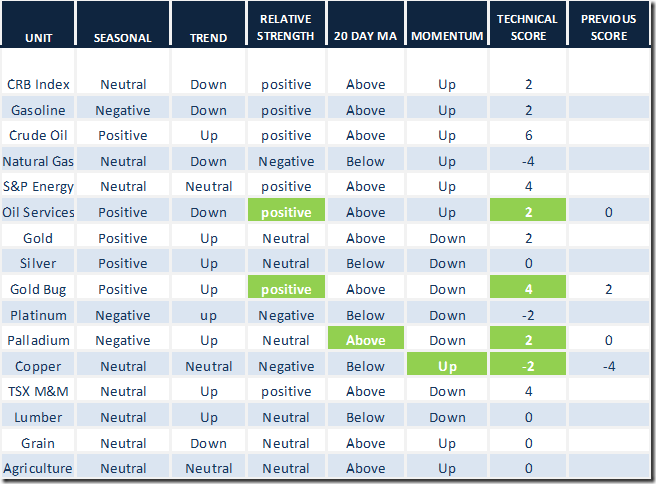
Daily Seasonal/Technical Commodities Trends for August 18th 2016
Green: Increase from previous day
Red: Decrease from previous day
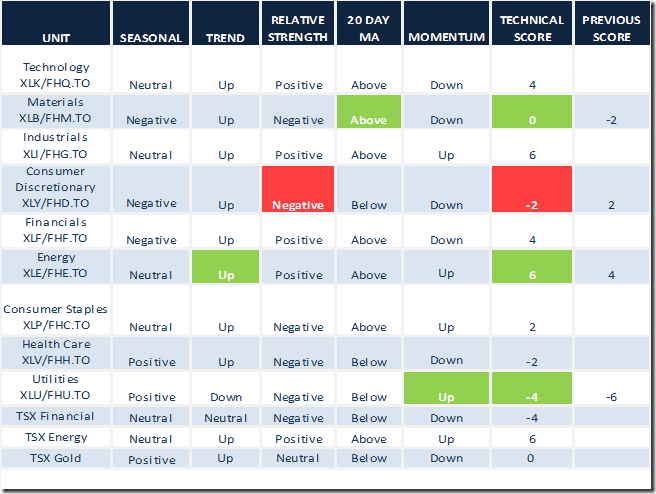
Daily Seasonal/Technical Sector Trends for August 18th 2016
Green: Increase from previous day
Red: Decrease from previous day
Special Free Services available through www.equityclock.com
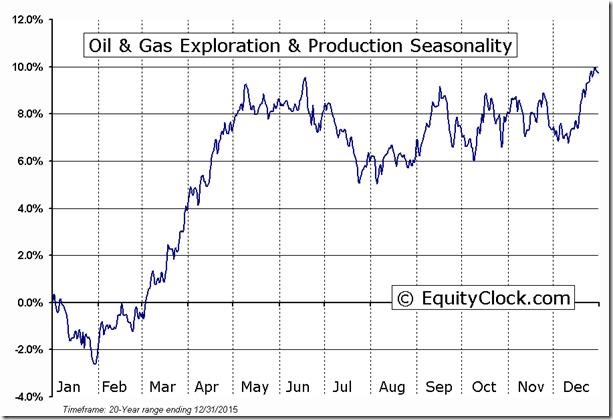
Equityclock.com is offering free access to a data base showing seasonal studies on individual stocks and sectors. The data base holds seasonality studies on over 1000 big and moderate cap securities and indices. To login, simply go to http://www.equityclock.com/charts/ Following is an example:
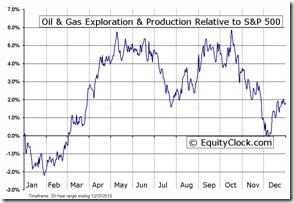
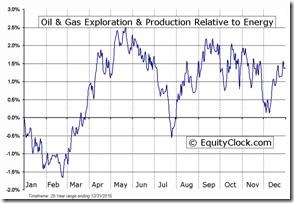
Oil & Gas Exploration & Production Industry Seasonal Chart
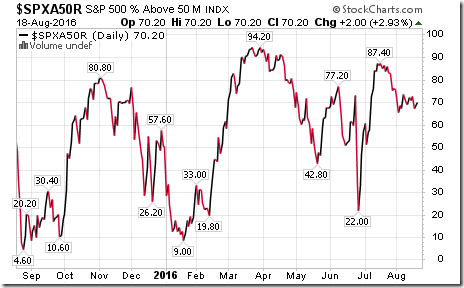
S&P 500 Momentum Barometer
The Barometer added 2.00 to 70.20. It remains intermediate overbought and trending down.
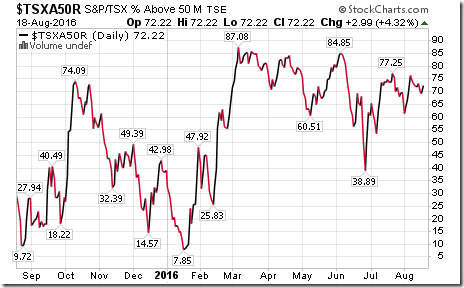
TSX Composite Momentum Barometer
The Barometer added 2.99 to 72.22. It remains intermediate overbought and rolling over.
Disclaimer: Seasonality and technical ratings offered in this report by www.timingthemarket.ca and www.equityclock.com are for information only. They should not be considered as advice to purchase or to sell mentioned securities. Data offered in this report is believed to be accurate, but is not guaranteed
Copyright © DV Tech Talk, Timingthemarket.ca


