
It has definitely been a tale of two small-cap equity markets when looking at either side of the border; both consist of similar industry or sector names, but the major differences lie in the percentage weights. For this week's Equity Leaders Weekly, we are going to look at Canadian Venture Index and compare it to the Russell Microcap Index via the iShares Micro-Cap ETF.
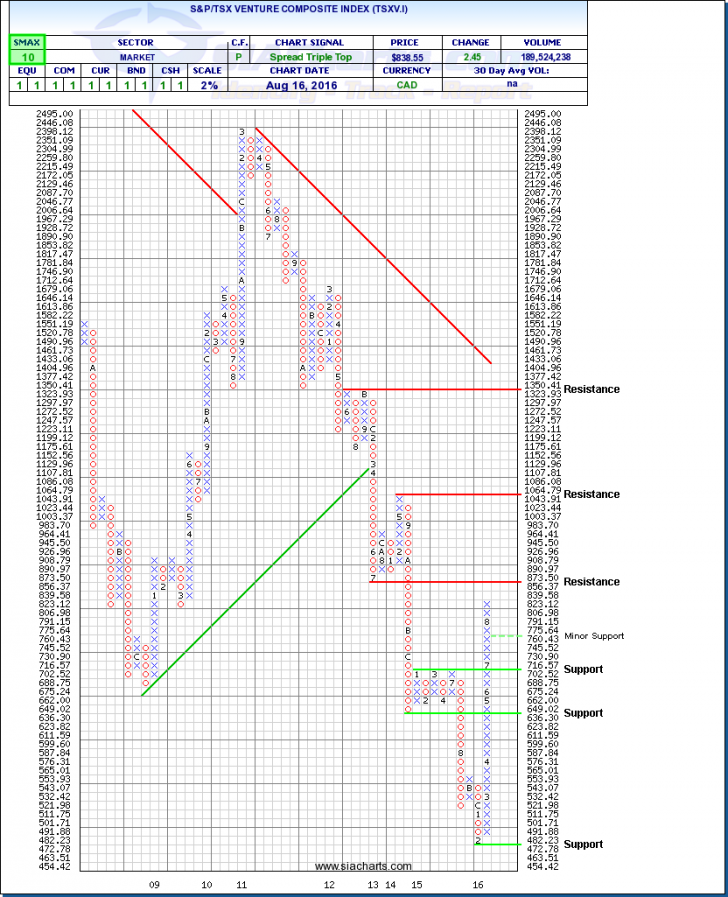
S&P/TSX Venture Composite Index (TSXV.I)
We last looked at this chart back on April 29, 2015 where it looked to be forming a base after a substantial decline starting back in 2011. To the surprise of many, the index after consolidating sideways for a few more months broke support at the 636 level and journeyed further down until finally finding a bottom in February of this year.
The rebound since then on a percentage basis has been extraordinary; the index has been one of the best performing indices in the world up over 70% since February. Over the past 6 months as you can see on the chart, the S&P/TSX Venture Composite Index has moved straight up without a single 3 box pullback. The move easily broke through past resistance at the 650 level and continued through additional resistance beyond 700; these two areas now serve as support levels. Further strength will find resistance at 873 and then higher at around 1050.
To determine what sectors are driving this index back up we need to look at the components of the index; the main dragging forces which brought it down are the same ones moving it back up. The mining exploration companies comprise of over 57% of the index (401 total listings) and the second largest sector is energy representing more than 13% of the constituents in oil and gas exploration, and energy services companies. With well over 70% of the index exposed to these two sectors which have been in a major turnaround, it is obvious to see why this Canadian stock market index has seen such a rebound over the past six months.
On a side note, an interesting article* yesterday in the Financial Post described a scenario where we can potentially see some weakness coming to this sector over the next few weeks and months ahead. Mentioned in the article `there have been more than 600 private placements of capital injected into the index since the first quarter, and the unfortunate side effect is profit taking as the typical four-month hold period on private placement shares expire, and they become free trading.`As a result of the hold period coming to an end, the author speculates that `there will be many companies that may suffer a decrease in value`. It will be very interesting on where this index moves to over the next few months.
*http://business.financialpost.com/midas-letter/tsx-venture-set-for-correction-as-private-placements-become-free-trading
Click on Image to Enlarge
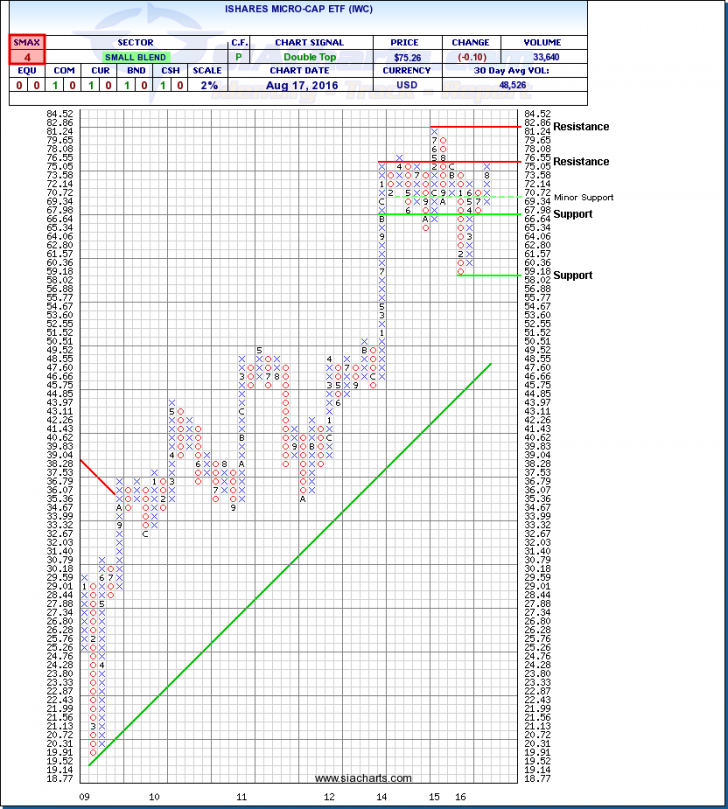
Russell Microcap Index via iShares Micro-Cap ETF (IWC)
Looking south of the border and at the attached chart, we can see a very different story. The iShares Micro-Cap ETF which attempts to track the Russell Microcap Index has been in a solid uptrend since 2009 with only a few hiccups along the way. The ETF which gives exposure to very small public US companies has a portfolio make-up drastically different than the Canadian Venture Index. Within the IWC, Mining and Energy account for less than 7% of the fund; the heaviest weighting are towards Financials at around 28%, Health Care at 20%, Information Technology at 15%, and Consumer Discretionary names at around 13%.
From the chart you can see that the shares are not too far away from historical highs. A break through current resistance at $76.55 could open for a re-test to new highs and resistance at $82.86.
It is interesting to note that even with this strong uptrend, the ETF has an SMAX score of 4 out of 10, showing near term weakness against most of the asset classes. For the past 2 years the ETF has been consolidating sideways so you may want to keep an eye on IWC to see how long this uptrend can remain intact.
Click on Image to Enlarge
SIACharts.com specifically represents that it does not give investment advice or advocate the purchase or sale of any security or investment. None of the information contained in this website or document constitutes an offer to sell or the solicitation of an offer to buy any security or other investment or an offer to provide investment services of any kind. Neither SIACharts.com (FundCharts Inc.) nor its third party content providers shall be liable for any errors, inaccuracies or delays in content, or for any actions taken in reliance thereon.
For a more in-depth analysis on the relative strength of the equity markets, bonds, commodities, currencies, etc. or for more information on SIACharts.com, you can contact our customer support at 1-877-668-1332 or at siateam@siacharts.com.