What Happens When the S&P 500, Dow, and Nasdaq All Make New Highs?
by LPL Research
Last Thursday, the S&P 500, Dow, and Nasdaq all made new all-time highs on the same day for the first time since December 31, 1999. This event has drawn a good deal of attention, as that last occurrence was right before the tech bubble burst, the Nasdaq dropping nearly 50% the next year, and the S&P 500 dropping three straight years for the first time in a generation. Could last Thursday be a warning of bad things to come?
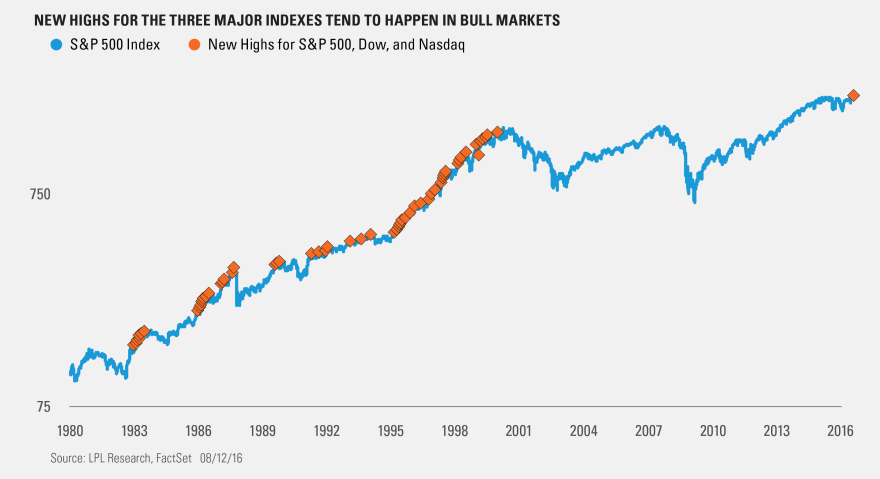
First things first, going back to data on the Nasdaq since 1979, the three major indexes have made new highs on the same day 148 other times besides last week. As this chart shows, the majority of these took place in the midst of larger bull markets. Yes, one happened right ahead of the 1987 crash and then the recent one took place at the end of a nine-year win streak for stocks—but the majority of the time these took place in uptrends or potential consolidations.
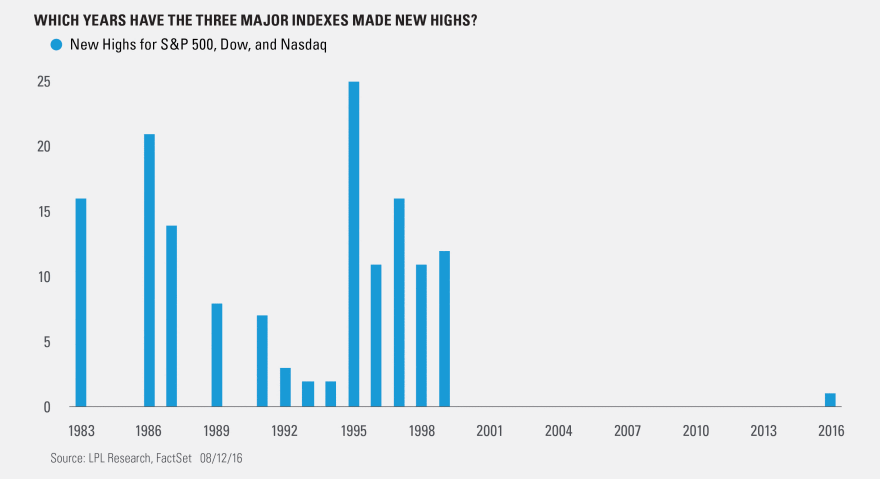
Breaking it down by years, 1995 had a record 25 times the S&P 500, Dow, and Nasdaq all made new highs on the same day. That of course was one of the strongest years ever for equities, with S&P 500 gaining 34% and the Nasdaq soaring nearly 40%.
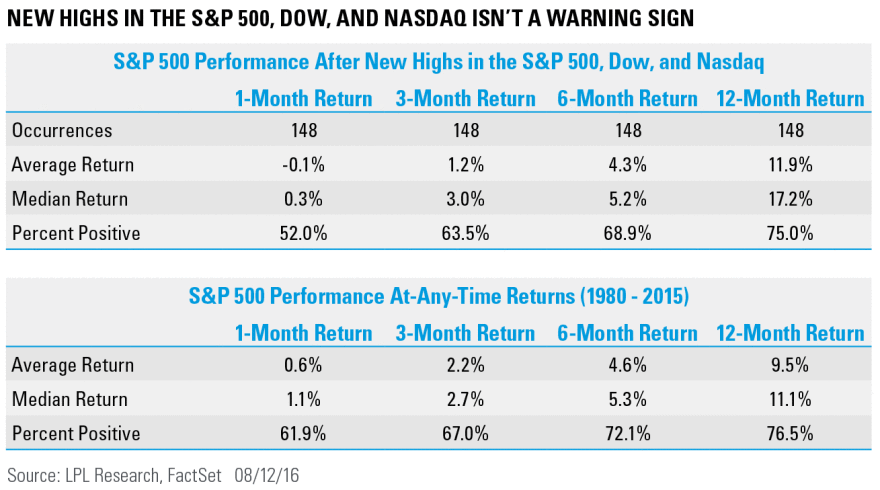
Looking at the returns on the S&P 500 after this takes place does show the potential for some near-term weakness going out three months, but going out longer things appear to get back to normal. In fact, a year after this happens, the S&P 500 is up a median of 17.2%—well above the at-any-time median return of 11.1%.
This event doesn’t appear to be a major warning sign for equities. There could be a near-term pullback or consolidation, but bigger picture this looks like more of a positive than a negative. After the S&P 500 just had its tightest two-year consolidation in 20 years, this breakout looks technically strong. Lastly, one major different between now and 1999 worth noting is market breadth is much different. In 1999 tech was about the only sector leading, with other groups breaking down and not pulling their weight. Eventually, this weak underpinning cracked. Compare that to today, where various sectors are participating and the NYSE advance/decline line just made another new all-time high, suggesting breadth is strong and this advance is healthy.
Copyright © LPL Research
*****
IMPORTANT DISCLOSURES
Past performance is no guarantee of future results. All indexes are unmanaged and cannot be invested into directly. Unmanaged index returns do not reflect fees, expenses, or sales charges. Index performance is not indicative of the performance of any investment.
The economic forecasts set forth in the presentation may not develop as predicted.
The opinions voiced in this material are for general information only and are not intended to provide or be construed as providing specific investment advice or recommendations for any individual security.
Stock investing involves risk including loss of principal.
The S&P 500 Index is a capitalization-weighted index of 500 stocks designed to measure performance of the broad domestic economy through changes in the aggregate market value of 500 stocks representing all major industries.
The Nasdaq Composite Index measures all Nasdaq domestic and non-U.S.-based common stocks listed on the Nasdaq stock market. The index is market-value weighted. This means that each company’s security affects the index in proportion to its market value. The market value, the last sale price multiplied by total shares outstanding, is calculated throughout the trading day, and is related to the total value of the index. It is not possible to invest directly in an index.
The Dow Jones Industrial Average Index is comprised of U.S.-listed stocks of companies that produce other (non-transportation and non-utility) goods and services. The Dow Jones industrial averages are maintained by editors of The Wall Street Journal. While the stock selection process is somewhat subjective, a stock typically is added only if the company has an excellent reputation, demonstrates sustained growth, is of interest to a large number of investors, and accurately represents the market sectors covered by the average. The Dow Jones averages are unique in that they are price weighted; therefore, their component weightings are affected only by changes in the stocks’ prices.
This research material has been prepared by LPL Financial LLC.
To the extent you are receiving investment advice from a separately registered independent investment advisor, please note that LPL Financial LLC is not an affiliate of and makes no representation with respect to such entity.
Not FDIC/NCUA Insured | Not Bank/Credit Union Guaranteed | May Lose Value | Not Guaranteed by any Government Agency | Not a Bank/Credit Union Deposit
Securities and Advisory services offered through LPL Financial LLC, a Registered Investment Advisor
Member FINRA/SIPC
Tracking #1-5260048 (Exp. 08/17)


