
SIA Equity Leaders Weekly: A Look at Strength in Gold, Natural Gas, and Oil
This week, in the SIA Equity Leaders Weekly we are going to take a look into the commodities asset class by giving an update on Gold (GC.F) as it continues on its bullish run and we will look at the energy complex through a comparison of Natural Gas (NG.F) versus Crude Oil (CL.F) to understand the potential relationship between the two and where the strength is coming from. Recent market events like Brexit have had some rippling effects on the financial markets with risk averse trades being the driving factors. We have seen flights to safe haven assets like Gold, the Japanese Yen, and bonds, where 10-yr yields have hit new lows in both the US and Japan.
Gold (GC.F)
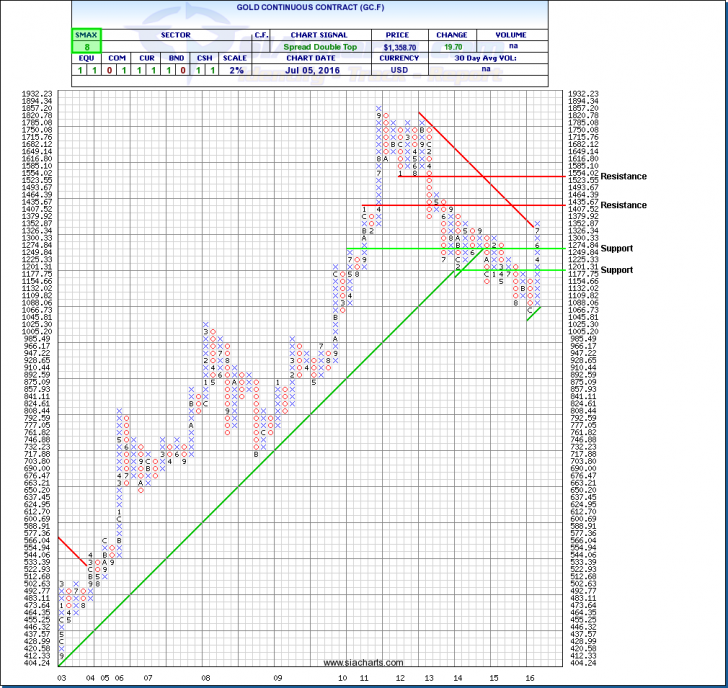
Uncertainty in the markets is always good news for Gold, which has been the story the last couple of weeks as the price of bullion has pushed to levels not seen since 2014, settling at $1363 as of Wednesday’s close. Additionally, since the British referendum, several Fed policy makers have said that the uncertainty warrants caution as to see how things play out which is short term positive for GC.F.
In looking at the 2% gold chart we can see that there was an important move recently with a close above $1352.87 where we see the long term downtrend line being broken where gold had been in a downtrend since 2011. We can see the next level of resistance for GC.F is at $1435.67 and a move through this could see the next resistance at $1554.02 come into play. There is support $1249.84 and below this ~$1200. With an SMAX score of 8 out of 10 there is short term relative strength in gold versus the asset classes.
With a new uptrend in the commodity, there is increased potential for successful trades in the gold space, however tread cautiously as it is an extremely volatile sector and be sure not to get caught in emotional trades.
Click on Image to Enlarge
Natural Gas vs. Crude Oil (NG.F vs CL.F)
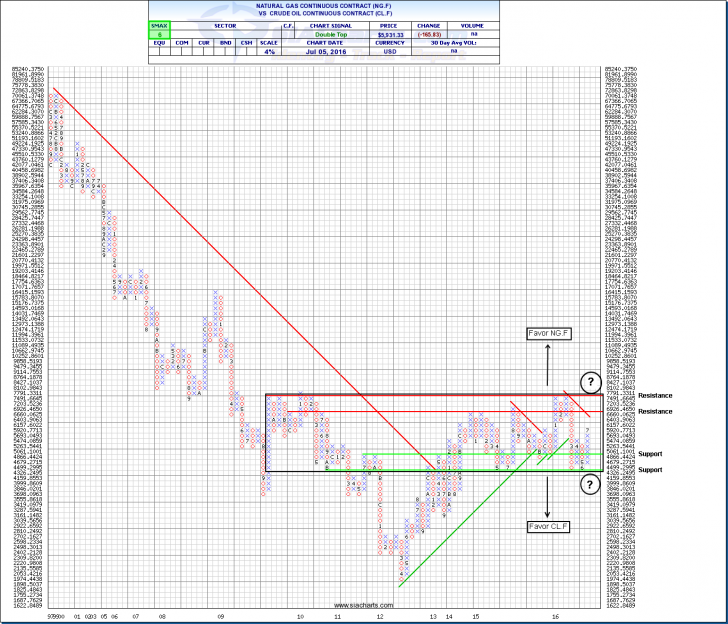
Next we will take a look at a comparison chart of Natural Gas versus Crude Oil. There has been a lot of talk about crude oil recently as it is up over 75% since lows seen in February as the market still tries to works its way back into balance after having some global supply disruptions in Q1 and Q2. Natural Gas has also been posting some strong positive moves this year after hitting all-time lows in March at $1.62. We have since seen a ~70% move upwards to a close of $2.794 on Wednesday. It is not unusual to see a rally in natural gas during this time of the year when the commodity generally bounces off seasonal lows in the spring.
The comparison chart tells us a unique story about the two commodities. Prior to 2012 there was significant out-performance of crude versus gas as indicated by the red downtrend line. That trend reversed in 2012 with natural gas being the relative outperformer. Since late 2014 where we see a consolidation between the two with a fairly tight trading range. Those who pay close attention to the energy space can look to key support and resistance levels for guidance going forward. A break through resistance levels signals strength to natural gas which will likely roll into more gas heavy producers however a short term trend reversal and a close below key support signals strength to crude and oil producers. Currently we can see a column of x’s in favour of natural gas in terms of relative strength which is also confirmed by the VS SMAX of 6 which is near term in favour of NG.F.
Click on Image to Enlarge
SIACharts.com specifically represents that it does not give investment advice or advocate the purchase or sale of any security or investment. None of the information contained in this website or document constitutes an offer to sell or the solicitation of an offer to buy any security or other investment or an offer to provide investment services of any kind. Neither SIACharts.com (FundCharts Inc.) nor its third party content providers shall be liable for any errors, inaccuracies or delays in content, or for any actions taken in reliance thereon.
For a more in-depth analysis on the relative strength of the equity markets, bonds, commodities, currencies, etc. or for more information on SIACharts.com, you can contact our customer support at 1-877-668-1332 or at siateam@siacharts.com.