Ryan Lewenza: Technically Speaking (02/17/2016)
by Ryan Lewenza, CFA, CMT, Private Client Strategist, Raymond James
Highlights
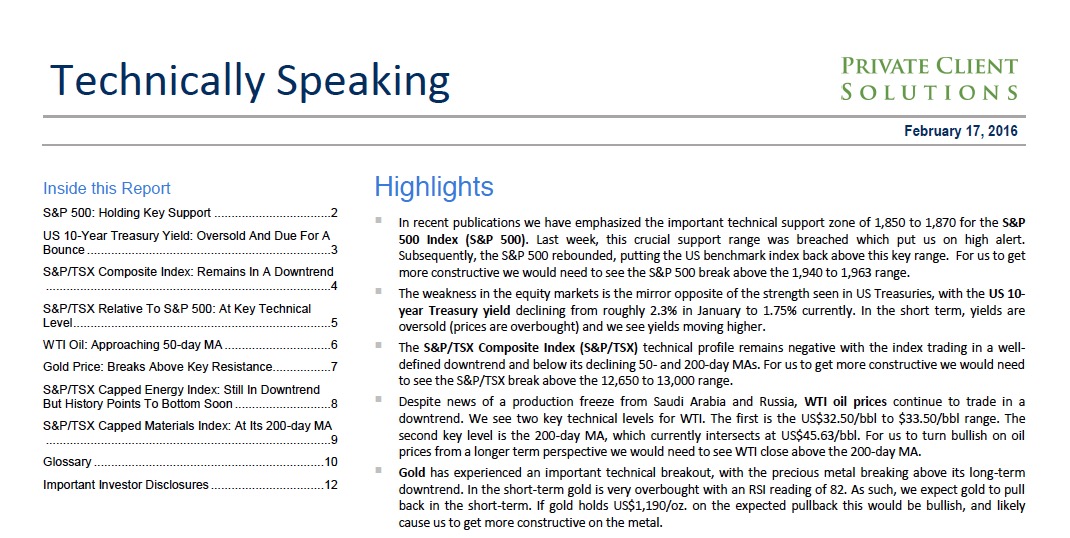
• In recent publications we have emphasized the important technical support zone of 1,850 to 1,870 for the S&P 500 Index (S&P 500). Last week, this crucial support range was breached which put us on high alert. Subsequently, the S&P 500 rebounded, putting the US benchmark index back above this key range. For us to get more constructive we would need to see the S&P 500 break above the 1,940 to 1,963 range.
• The weakness in the equity markets is the mirror opposite of the strength seen in US Treasuries, with the US 10-year Treasury yield declining from roughly 2.3% in January to 1.75% currently. In the short term, yields are oversold (prices are overbought) and we see yields moving higher.
• The S&P/TSX Composite Index (S&P/TSX) technical profile remains negative with the index trading in a well-defined downtrend and below its declining 50- and 200-day MAs. For us to get more constructive we would need to see the S&P/TSX break above the 12,650 to 13,000 range.
• Despite news of a production freeze from Saudi Arabia and Russia, WTI oil prices continue to trade in a downtrend. We see two key technical levels for WTI. The first is the US$32.50/bbl to $33.50/bbl range. The second key level is the 200-day MA, which currently intersects at US$45.63/bbl. For us to turn bullish on oil prices from a longer term perspective we would need to see WTI close above the 200-day MA.
• Gold has experienced an important technical breakout, with the precious metal breaking above its long-term downtrend. In the short-term gold is very overbought with an RSI reading of 82. As such, we expect gold to pull back in the short-term. If gold holds US$1,190/oz. on the expected pullback this would be bullish, and likely cause us to get more constructive on the metal.
• The S&P/TSX Capped Energy Index remains in a long-term downtrend, and is trading below its declining 50- and 200-day MAs. From a technical perspective, there is little reason to aggressively buy energy stocks at present. However, history suggests that the bottom in the energy sector is close. Since 1980, there have been six major bear markets for the S&P/TSX energy sector and on average they lasted 15 months with the sector declining 47% peak-to-trough. The current bear market has lasted 18 months with a 46% decline. This analysis suggests that a bottom is getting closer.
• In recent weeks the materials sector has rebounded in large part due to strong gains from gold miners. The S&P/TSX Capped Materials Index is now trading at its 200-day MA and at horizontal price resistance. If the index can break above 190, this would reverse the long-term downtrend, and likely cause us to revisit our bearish view of the sector.
Read/Download the complete report below:
Technically Speaking - February 17, 2016
Copyright © Raymond James


