U.S. Equities vs. Canadian Equities – A Look at Relative Strength
For this week’s SIA Equity Leaders Weekly, we are going to re-examine both the broad U.S. Equity market via the S&P 500 Composite Index and the main Canadian equity index, the TSX Composite. The last time we took a look at each of these together they were heading in opposite directions; the one testing a record high resistance level, and the other sliding towards significant support. The divergence we had seen in early November has shifted; what they both have in common so far for 2016 is a strong correlated negative price movement.
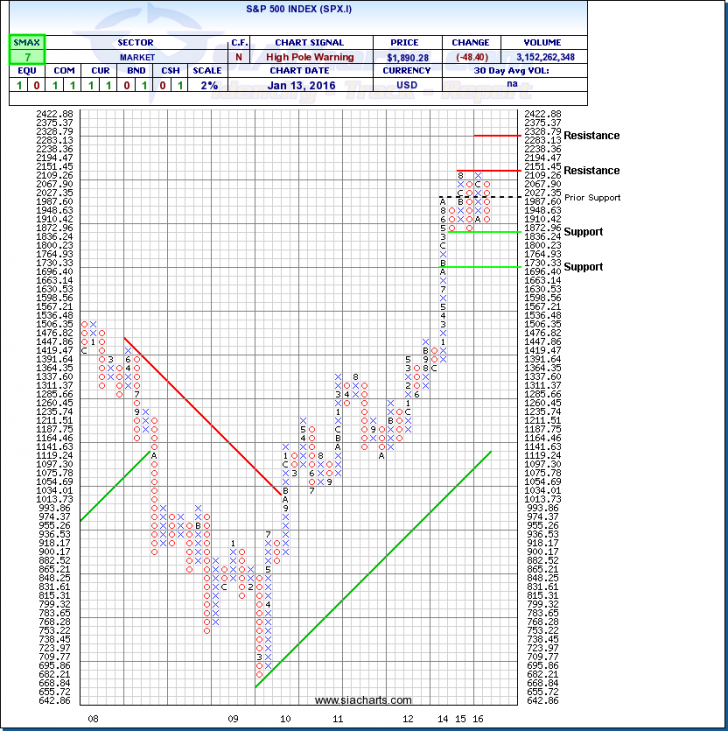
S&P 500 Index (SPX.I)
When we last looked at the S&P 500 Index (SPX.I) point and figure chart back in early November 2015, we commented on it being range bound between support at 1836 and resistance at 2151. That very strong resistance level which it had again came up against failed to break though in December. Now even though, the start of 2016 has been plagued with negative news and returns, we need to notice that so-far, the S&P 500 Index is still within this very defined long-term trading range. Strong support is still seen at the 1836 level; a closing move below that level could signal additional weakness to come. A sort of saving grace for the Canadian investor as of late for this US Equity weakness has been the offsetting rise in the USD vs. the CAD.
Remember, U.S. Equity is still one of the top ranked asset classes in the SIA long-term relative strength ranking. The SPX.I is an important chart to monitor to see if it breaks through support or once again bounces for another re-test of that 2151 resistance. With an SMAX score of 7 out of 10, the SPX.I is still showing near-term strength against all other asset classes.
Click on Image to Enlarge
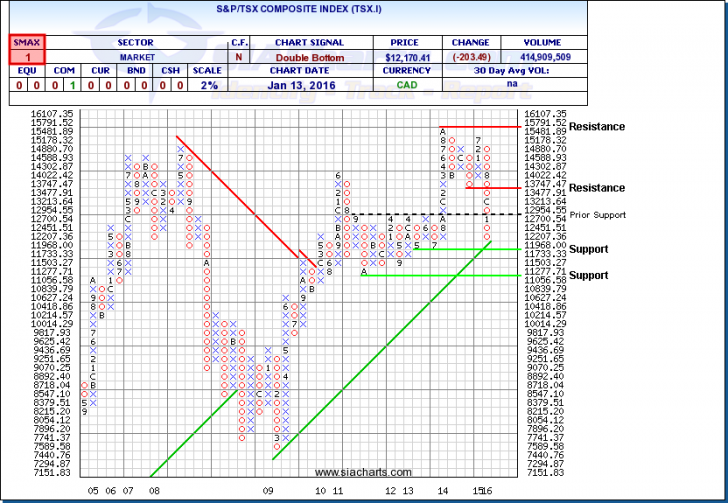
S&P/TSX Composite Index (TSX.I)
Similar to the U.S. Equity index we looked at above, the Canadian S&P/TSX Composite Index (TSX.I) is having a terrible start to 2016. But unlike the S&P 500 Index, the TSX didn't experience a challenge to its prior highs but instead continued much of what we had been accustomed too since July of last year. Major support seen at the 12,700 level which many expected to hold based on its history (see 'Prior Support' on chart) couldn't match the strong selling pressure over the last two weeks.
Now we are upon new support at the 11,733 level which also sees the upward long term trend line which has been in effect since 2009 come into play. With financials and energy stocks continuing to slide the TSX has fallen to a two and a half year low. Below 11,733, we then find support right around 11,000.
With an SMAX score of 1 out of 10, the TSX.I is showing near-term weakness against all of the other asset classes.
Click on Image to Enlarge
SIACharts.com specifically represents that it does not give investment advice or advocate the purchase or sale of any security or investment. None of the information contained in this website or document constitutes an offer to sell or the solicitation of an offer to buy any security or other investment or an offer to provide investment services of any kind. Neither SIACharts.com (FundCharts Inc.) nor its third party content providers shall be liable for any errors, inaccuracies or delays in content, or for any actions taken in reliance thereon.
For a more in-depth analysis on the relative strength of the equity markets, bonds, commodities, currencies, etc. or for more information on SIACharts.com, you can contact our customer support at 1-877-668-1332 orsiateam@siacharts.com.