Apples and Oranges: A Random Portfolio Case Study
by Adam Butler, Resolve Asset Management
This article was motivated by a provocative discussion with a thoughtful RIA. Let’s call him Harry.
Harry expressed some disappointment with the performance of Global Tactical Asset Allocation (GTAA) strategies over the past few years relative to some popular tactical U.S. sector rotation funds.
Harry’s definition of GTAA is any strategy that regularly alters its allocation across a wide variety of global equity markets and asset classes, including bonds, REITs, commodities, and cash. In contrast, tactical U.S. sector products attempt to earn active returns by allocating to the most prospective U.S. equity sectors. In addition, many of the sector strategies can hold substantial amounts in cash when few or no sectors are attractive.
Harry’s point, which is fair in many respects, is that the goal of investing in tactical U.S. sector products is the same as the goal of investing in GTAA products – strong risk-adjusted returns with a smooth equity curve and manageable drawdowns. As an investor, he doesn’t care how his wealth is created, only that it has a reasonable upward slope with fairly small wiggles around the upward trend. If U.S. sectors are more likely to do the trick, that’s where he’d like his money to be.
Unfortunately, there is a major flaw in this logic. You see, even awful U.S. sector rotation products would have been expected to beat top tier GTAA strategies over the past few years. To understand why, consider that an active manager’s ability to deliver returns depends on three factors, which vary in importance through time:
- Manager skill – All else equal, a skilled manager will deliver higher risk-adjusted performance over the long-term.
- Number of independent bets – A manager with skill who makes many bets will have better results than another manager with similar skill who makes fewer bets.
- Opportunity set – If two managers are equally skilled, but one manager is choosing among investments that are all booming while the other is choosing between a group of investments that are all busting, the former manager will prevail almost every time (subject to long-only constraint).
Depending on the interplay between these three factors, mediocre managers operating on an especially strong investment universe should quite often be expected to outperform even very skilled managers who are operating on a weaker universe. Worse, the dynamic and unpredictable nature of global markets are such that this situation can persist for much longer than might seem intuitively reasonable. This makes distinguishing manager skill from luck extremely challenging, especially over short horizons like 3 to 5 years.
To truly gain an understanding of the difference between the opportunities presented by two investment universes, it is helpful to invoke the concept of ‘random portfolios’. Random portfolios are created by randomly assigning portfolio weights among eligible assets in a universe at each rebalance date. It is possible to impose constraints on the character of the random portfolios, such as: all weights must be positive; weights must sum to 1; maximum weights in certain assets; minimum, maximum or target number of holdings, etc., in order to model the true opportunity set available to a manager.
In the following analysis, we examine the relative opportunity sets available to GTAA managers vs. U.S. sector managers over time. Our intention is to discover the relative opportunity – in the form of return distributions – available to managers in each universe over rolling annual periods from 1995 – 2015. To do so, we created 10,000 random portfolios each quarter rom a universe of 10 global asset classes, and another 10,000 portfolios from a universe of 10 global sectors plus cash. At each quarterly rebalance date, random portfolios from each universe are formed, and the daily returns for each portfolio are saved over the subsequent quarterly period. Annual returns are then formed from rolling 4 quarterly periods through time.
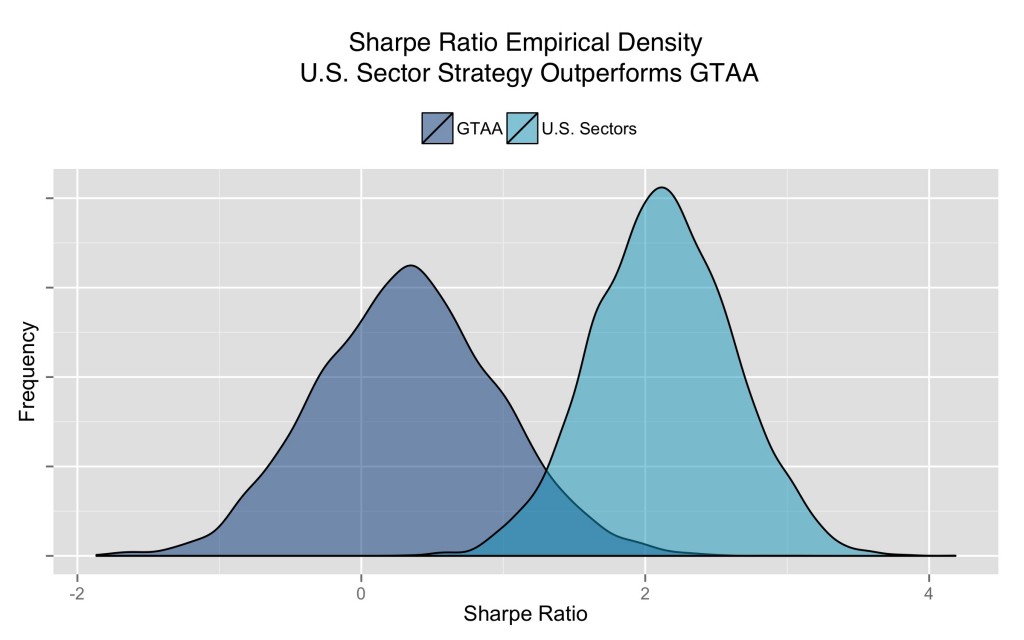
Figure 1. provides a snapshot of the annual period ending September 2014, where most random sector portfolios performed substantially better than most random asset class portfolios. Note that, during this period the average Sharpe ratio for sector portfolios was over 2, while the average Sharpe ratio for asset class portfolios was about 0.4. In other words, if both U.S. sector focused managers and global asset allocation managers were monkeys picking portfolios at random, we would expect the average risk-adjusted performance of the sector monkeys to deliver over 4x the performance of the asset class monkeys.
The distributions around these means are also important to our analysis. From visual inspection, you can see that the 5th percentile outcome for sector portfolios (left tail of light blue plot) is about the same as the 95th percentile outcome for asset class portfolios (right tail of the dark blue plot) for this period. In other words, even the least skilled sector allocator choosing the best U.S. sectors over this period would be expected to deliver better performance than the most skilled asset allocator choosing the best assets.
Figure 1. Distribution of Sharpe ratios from 10,000 random portfolio simulations on an asset class and a U.S. sector universe, year ending Sep 30, 2014.
Data source: CSI
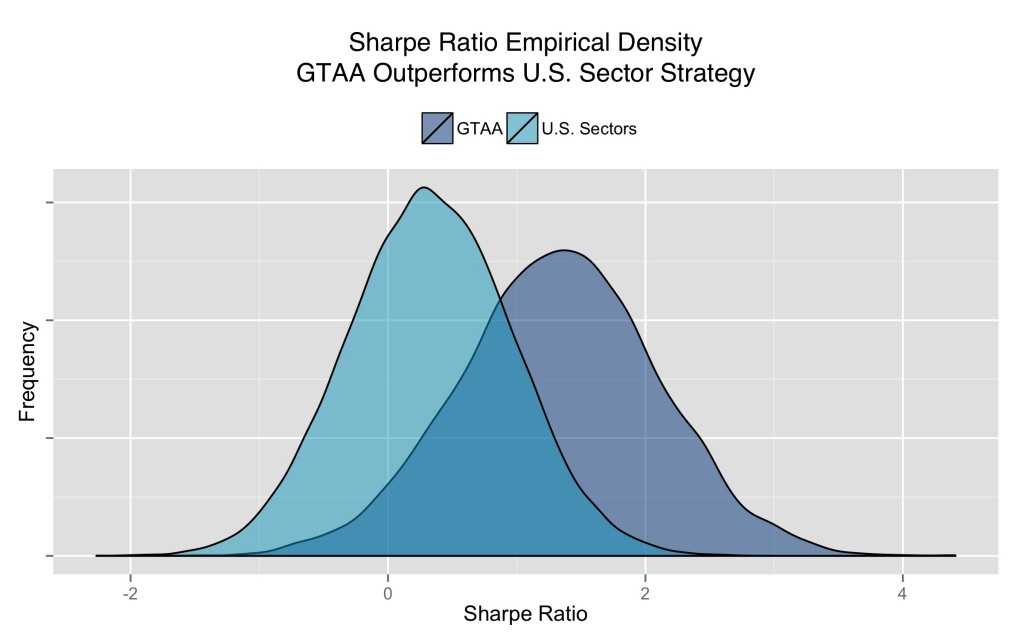
While Figure 1. highlights a period where sector strategies dominate asset allocation strategies, there are other periods where asset allocation strategies prevail over sector strategies. In Figure 2., we show a similar analysis for the 1 year period ending March 31, 2000, when asset allocation dominated sector strategies.
Figure 2. Distribution of Sharpe ratios from 10,000 random portfolio simulations on an asset class and a U.S. sector universe, year ending March 31, 2000.

Data source: CSI
Of course, we don’t expect our asset managers to act like monkeys. Presumably our managers have skill, and will perform better than what might be expected from random guesses. But we are specifically concerned with comparing an asset allocator’s performance with a sector allocator’s performance over a given observation horizon. In which case, we want to know the chance that portfolios selected by a manager in one universe over the past year would outperform portfolios selected by a manager in the other universe over the same period.
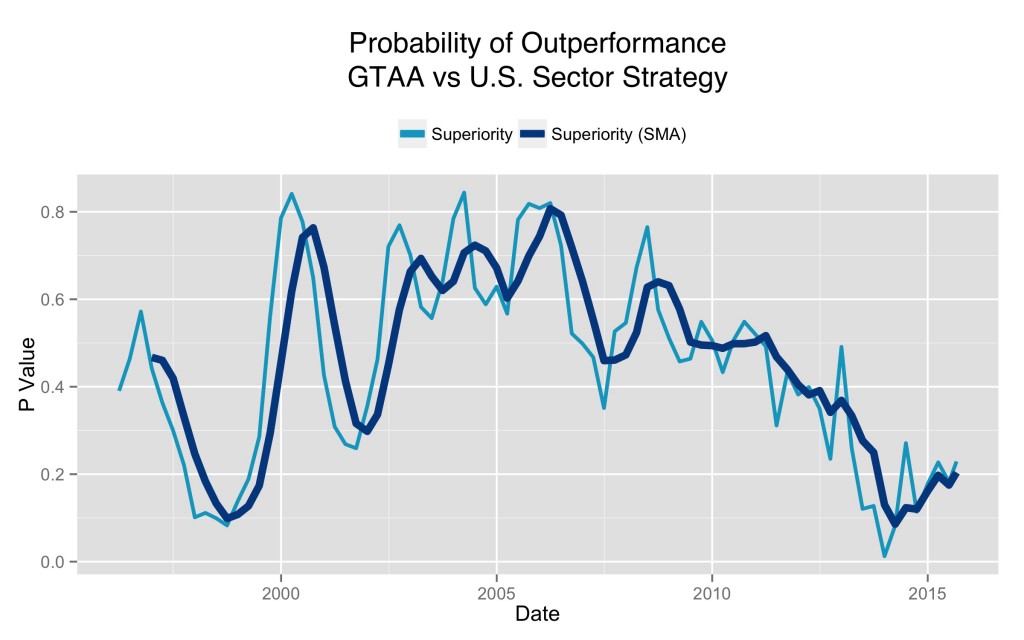
In Figure 3. we plot this quantity over time (for those who are curious, the statistic is called Probability of Superiority). Specifically, we plot the probability that a performance outcome drawn from the asset allocation distribution will exceed a performance outcome drawn from the sector distribution over trailing annual periods ending in each quarter from 1995 – 2015.
Figure 3. Probability that GTAA performance will exceed a sector performance.
Data source: CSI
An example will illustrate how to interpret Figure 3. The light blue line peaks in early 2000 at a value of 0.83, indicating that over the prior 4 quarters ending March 2000, there was an 83% chance that a portfolio chosen at random from the asset allocation universe would have a higher Sharpe ratio than a portfolio chosen at random from the sector universe. It follows that an asset allocation manager needn’t have been particularly skilled at that time to deliver better returns than a manager who was selecting among U.S. sectors. On the other hand, in the year ending September 2014, there was almost 0% chance that a portfolio chosen at random from the asset allocation universe would have had a higher Sharpe ratio than a randomly selected sector portfolio. As such, it would have been almost impossible for an asset allocator to deliver better performance in that period.
Another way of looking at the problem is from a direct examination of the relative skill that an asset allocator would have to exhibit in each period to deliver better performance than an average sector allocator. In investment management, skill is measured by Information Coefficient (IC), which is the correlation between ex ante investment bets and optimal ex post outcomes. It is a simple matter to calculate the IC that would be required in each period in order for an asset allocator to outperform a sector allocator because of the Fundamental Law of Active Management:
We have already calculated the performance of asset allocation vs. sector allocation in each period, and we know universe breadth averages for both strategies, so it is a simple matter to rearrange the terms of this equation to solve for the IC.
Using this equation, we can find the empirical IC over each rolling annual period. However, it is less obvious how to interpret Information Coefficient. Fortunately, it’s easy to translate IC into “win rate”, which is the percentage of time a manager makes a bet in the right direction. Win rate and IC are functionally equivalent for interpretation because .
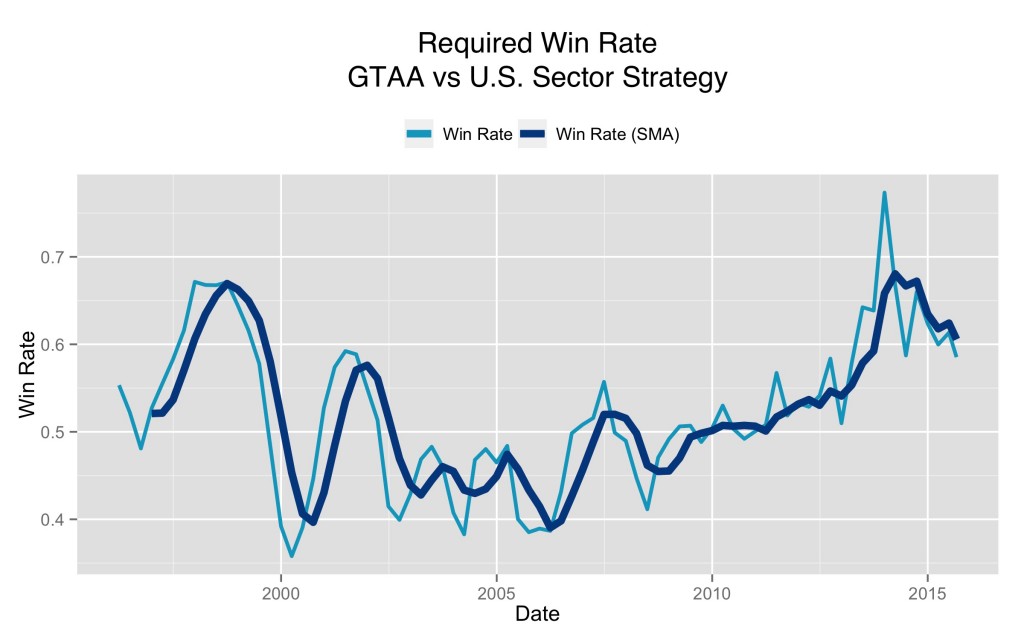
Once we have solved for the IC for each strategy in each period, we can find the excess win rate implied for the asset allocation universe vs. the sector universe. This rate tracks the relative skill that would be required for a manager of an asset allocation strategy to deliver better performance than a manager of a sector strategy in each trailing annual period. Figure 4. plots this value through time.
Figure 4. Win Rate that would be required for a GTAA manager’s performance to exceed a sector manager’s performance over trailing 4 quarters.
Data source: CSI
From Figure 4. we see that there are periods when even managers with negative skill at choosing asset classes (win rate < 0.5) will deliver better performance than sector allocators, and vice versa. Over the 4 quarters through Q2 2000, even an asset allocator who’s bets were accurate just 35% of the time would have delivered better performance than an average sector manager. In contrast, over the 4 quarters through Q3 2014, an asset allocator would have had to be accurate with over 78% of his bets to beat an average sector manager.
To put these win rates in perspective, Ding (2010) estimated the ICs for the value and momentum factors in U.S. equities to be 0.017 and 0.025 respectively, which translates to win rates of 50.85% and 51.25% respectively. We also calculated the implied win rates for the Global All Asset value and momentum factors from Asness et. al. (2012) to be 51.3% (they are effectively the same). Given that the strongest observed factors are observed to have average win rates of less than 52%, it is effectively impossible for a manager to overcome win rate hurdles of 55%-70%.
So where do things stand at the moment? Over the annual period ending August 31, 2015 it would have been practically impossible for an asset allocator to deliver stronger performance than a U.S. sector manager. In fact, over the past 8 quarters an asset allocator would have required a win rate over 60% in each period to be competitive with U.S. sectors, which is orders of magnitude higher than what we observe from the best long-term factors.
The fact is, there are periods when allocating in a concentrated way to one major asset class will pay off. But most investors’ concentrated allocation to U.S. stocks did not come about because of thoughtful active bets. Rather, investors are concentrated in U.S. stocks by default, because of home country bias. In addition, many U.S. advisors and CIOs are terrified of tracking error vs. U.S. stocks because the Dow and S&P are such strong emotional benchmarks for clients. This amplifies the already powerful home country bias dynamic.
But make no mistake – U.S. equity domination is a transient phenomenon. It is the financial equivalent to the ancient proverb about the tortoise and the hare. At the moment, U.S. stocks have stormed far ahead of the pack. However, U.S. stocks can not continue to outperform all other asset classes without driving an enormous valuation and yield advantage to other markets. Consider the 8 year period from 2001 – 2009, when even poorly executed global asset allocation strategies left U.S. sectors in the dust.
Those investors who default to concentrated U.S. equity portfolios and ‘balanced funds’ face a day of reckoning. Fortunately, investors have attractive choices for diversification. More passively minded investors might consider the Global Market Portfolio, or a global risk parity strategy. Experienced investors might consider more active approaches that take advantage of factor tilts, such as systematic GTAA strategies. There is no guarantee that global diversification will pay off in the next few weeks or even months. But over the long term, thoughtful global strategies have a much higher probability of delivering against investors’ financial goals. And isn’t that really the point of all this?
Copyright © Resolve Asset Management, via GestaltU.com

Disclaimer
Confidential and proprietary information. The contents hereof may not be reproduced or disseminated without the express written permission of ReSolve Asset Management Inc. (“ReSolve”). ReSolve is registered as an investment fund manager in Ontario and Newfoundland and Labrador, and as a portfolio manager and exempt market dealer in Ontario, Alberta, British Columbia and Newfoundland and Labrador.
These materials do not purport to be exhaustive and although the particulars contained herein were obtained from sources ReSolve believes are reliable, ReSolve does not guarantee their accuracy or completeness. The contents hereof does not constitute an offer to sell or a solicitation of interest to purchase any securities or investment advisory services in any jurisdiction in which such offer or solicitation is not authorized.
Forward-Looking Information. The contents hereof may contain “forward-looking information” within the meaning of the Securities Act (Ontario) and equivalent legislation in other provinces and territories. Because such forward-looking information involves risks and uncertainties, actual performance results may differ materially from any expectations, projections or predictions made or implicated in such forward-looking information. Prospective investors are therefore cautioned not to place undue reliance on such forward-looking statements. In addition, in considering any prior performance information contained herein, prospective investors should bear in mind that past results are not necessarily indicative of future results, and there can be no assurance that results comparable to those discussed herein will be achieved. The contents hereof speaks as of the date hereof and neither ReSolve nor any affiliate or representative thereof assumes any obligation to provide subsequent revisions or updates to any historical or forward-looking information contained herein to reflect the occurrence of events and/or changes in circumstances after the date hereof.
General information regarding returns. Performance data prior to August, 2015 reflects the performance of accounts managed by Dundee Securities Ltd., which used the same investment decision makers, processes, objectives and strategies as ReSolve has used since it became registered and commenced operations in August, 2015. Records that document and support this past performance are available upon request. Performance is expressed in CAD, net of applicable management fees. Indicated returns of one year or more are annualized. Past performance is not indicative of future performance.
General information regarding the use of benchmarks. The indices listed have been selected for purposes of comparing performance with widely-known, broad-based benchmarks. Performance may or may not correlate to any of these indices and should not be considered as a proxy for any of these indices. The S&P/TSX Composite Index (Net TR) (“S&P TSX TR”) is the headline index and the principal broad market measure for the Canadian equity markets. The Standard & Poor’s 500 Composite Stock Price Index (“S&P 500”) is a capitalization-weighted index of 500 stocks intended to be a representative sample of leading companies in leading industries within the U.S. economy.
General information regarding hypothetical performance and simulated results. These results are based on simulated or hypothetical performance results that have certain inherent limitations. Unlike the results in an actual performance record, these results do not represent actual trading. Also, because these trades have not actually been executed, these results may have under- or over-compensated for the impact, if any, of certain market factors, such as lack of liquidity. Simulated or hypothetical trading programs in general are also subject to the fact that they are designed with the benefit of hindsight. No representation is being made that any account or fund managed by ReSolve will or is likely to achieve profits or losses similar to those being shown. The results do not include other costs of managing a portfolio (such as custodial fees, legal, auditing, administrative or other professional fees). The contents hereof has not been reviewed or audited by an independent accountant or other independent testing firm. More detailed information regarding the manner in which the charts were calculated is available on request. Any actual fund or account that ReSolve manages will invest in different economic conditions, during periods with different volatility and in different securities than those incorporated in the hypothetical performance charts shown. There is no representation that any fund or account will perform as the hypothetical or other performance charts indicate.
General information regarding the simulation process. The systematic model used historical price data from Exchange Traded Funds (“ETFs”) representing the underlying asset classes in which it trades. Where ETF data was not available in earlier years, direct market data was used to create the trading signals. The hypothetical results shown are based on extensive models and calculations that are available for any potential investor to review before making a decision to invest.
© 2015 ReSolve Asset Management Inc. All rights reserved.


