SIA Weekly: Growth versus Value – Who's the leader?
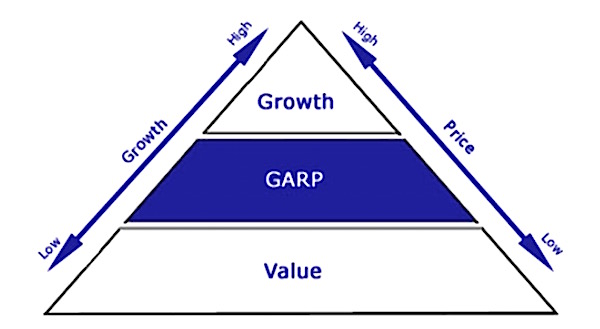
For this week’s SIA Equity Leaders Weekly, we are going to take a look at two important investment style themes of Growth Investing versus Value Investing (i.e. investing in Growth stocks versus Value stocks) and more specifically, a leadership change in regards to the comparison of growth stock’s performance versus value stock’s performance which has occurred since the end of 2007. These two investment style themes tend to be long term secular trends. We will examine this trend to see if a potential continuation of the current trend will resume going forward. We will focus on looking at the iShares S&P 500 Growth ETF (IVW). Then we will look at the comparison chart of the iShares S&P 500 Value ETF (IVE) vs. the iShares S&P 500 Growth ETF (IVW).
IShares S&P 500 Growth ETF (IVW)
In looking at the chart of the iShares S&P 500 Growth ETF (IVW), we see that It has been in a steady uptrend since the spring of 2009 (the bottom of the 2008/2009 stock market meltdown). It has continued to reach new highs until the summer of this year and has held up quite nicely during the last few months of market volatility we have been experiencing lately. Currently, there is minor resistance at $115.62 and above that, the next level of resistance is at the recent summer high of $120.29. Support is at $104.72 and, below that, $98.68. With an SMAX of 7 out of 10, IVW is showing near term strength against all asset classes.
Click on Image to Enlarge

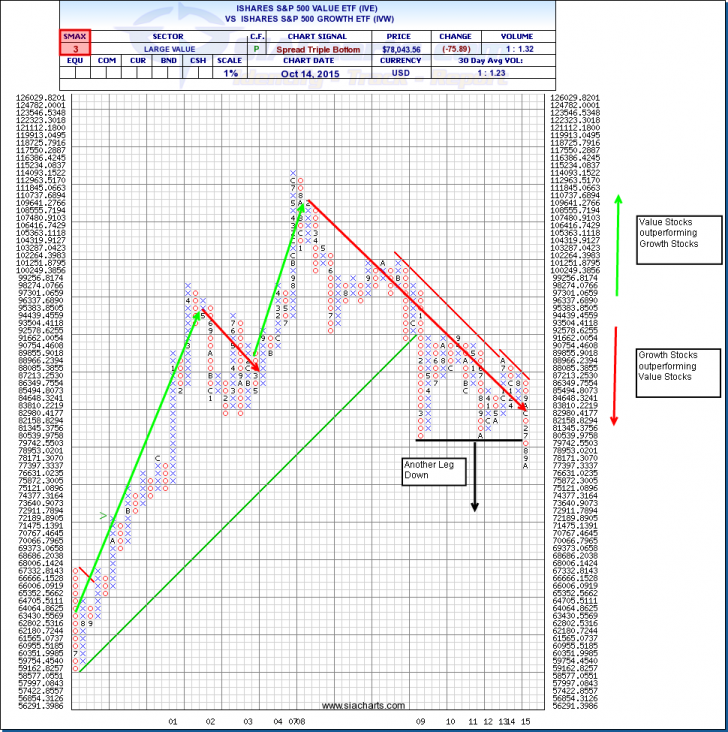
iShares S&P 500 Value ETF (IVE) vs. the iShares S&P 500 Growth ETF (IVW).
After looking at the chart of the iShares S&P 500 Growth ETF (IVW) and the strength that has occurred in IVW, we will now draw our attention to the comparison of Value Stock investing vs Growth Stock investing. In looking at the comparison chart of iShares S&P Value ETF (IVE) vs. iShares S&P 500 Growth ETF, we see a structural change had occurred at the end of 2007. In the attached comparison chart, a rising column of X’s indicates Value Stocks (IVE) had won the relative battle over Growth Stocks (IVW) and a descending column of O’s indicates Growth Stocks has won the relative battle over Value Stocks.
From the year 2000 until the end of 2007, we had seen Value Stocks had won the relative battle over Growth Stocks (with the exception of a brief period in the spring of 2001 to the end of 2002 where there was a slight over performance from the growth stocks). Since the beginning of 2008 until now, you can see that Growth has won the relative battle over Value. In looking at the chart closer, since July of this year we have seen a major support level broken for the iShares S&P 500 Value ETF and a new leg down has ensued. We have not seen levels such as these since the beginning of 2001. With a VS. SMAX score of only 3 out of 10, that potentially indicates further underperformance in IVE vs. IVW and perhaps a further move down in the comparison chart which would favor Growth Stocks moving forward. One must take note of this significant resumption of trend favoring Growth Stocks over Value Stocks. It is very important to note, the comparison chart attached does not mean Value stocks are exhibiting overall market weakness. It is merely reflecting Growth oriented stocks have outperformed Value stocks on a relative basis against each other.
Click on Image to Enlarge
SIACharts.com specifically represents that it does not give investment advice or advocate the purchase or sale of any security or investment. None of the information contained in this website or document constitutes an offer to sell or the solicitation of an offer to buy any security or other investment or an offer to provide investment services of any kind. Neither SIACharts.com (FundCharts Inc.) nor its third party content providers shall be liable for any errors, inaccuracies or delays in content, or for any actions taken in reliance thereon.
For a more in-depth analysis on the relative strength of the markets, commodities, currencies or for more information on SIACharts.com, you can contact our customer support at 1-877-668-1332 or siateam@siacharts.com.
Copyright © SIACharts.com