For this week's SIA Equity Leaders Weekly, we are going to look at the two important commodities again as Gold hits new 5-year lows and Silver continues to show weakness. We have focused a lot on the USDCAD currency and Crude Oil in past Equity Leaders Weekly articles which still continue to hold true, so for more information on any past articles on these topics, please contact us or if you are a subscriber to our SIACharts.com, you can find all historical articles on the website to help understand if the strengthening of the US Dollar is related to the decline in gold.
Gold Continuous Contract (GC.F)
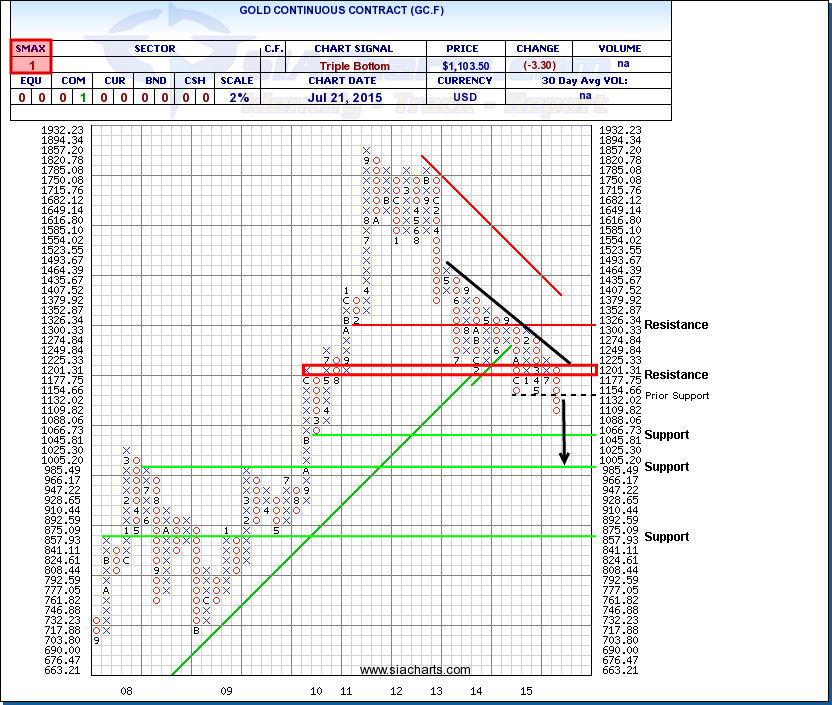
Gold is down for a 10th straight day which is the longest such streak in roughly 20 years. Gold has continued to move downwards after breaking through its past support level at $1132 moving lower below $1100 for the first time in 5 years. As the black trend line shows on the chart, Gold Continuous Contract (GC.F) has been on a gradual downwards slope over the past 2 years, but again has moved to lower lows now with the support levels at $1045 and around $1000 at $985 coming into play if this weakness continues. To the upside, resistance can be found in the area around $1200-$1225.
From our prior commentary in the middle of March, the support level at $857 was drawn to show how much downside Gold could possibly still have left it this weakness continues. There will always be very short-term opportunities with a volatile commodity like Gold, but the SMAX score of 1 out of 10, shows an overall 1 to 3 month outlook of weakness against each asset class as well as the Commodity asset class and the Metals and Mining sector still ranking at the bottom of their respective relative strength rankings.
Stocks in the SIA S&P/TSX 60 Report for example that are more reliant on gold prices like YRI.TO, ELD.TO, ABX.TO, and K.TO are down approximately -43.4%, -29%, -32%, and -38.4% all while in the Unfavored zone at the bottom of the report this past month as of July 21st close. Having the confidence through relative strength to stay away from these higher risk stocks and those types of drawdowns in your portfolio is one of the main reason SIA does this commentary every week to help advisors make these tough decisions through risk management.
Click on Image to Enlarge
Silver Continuous Contract (SI.F)
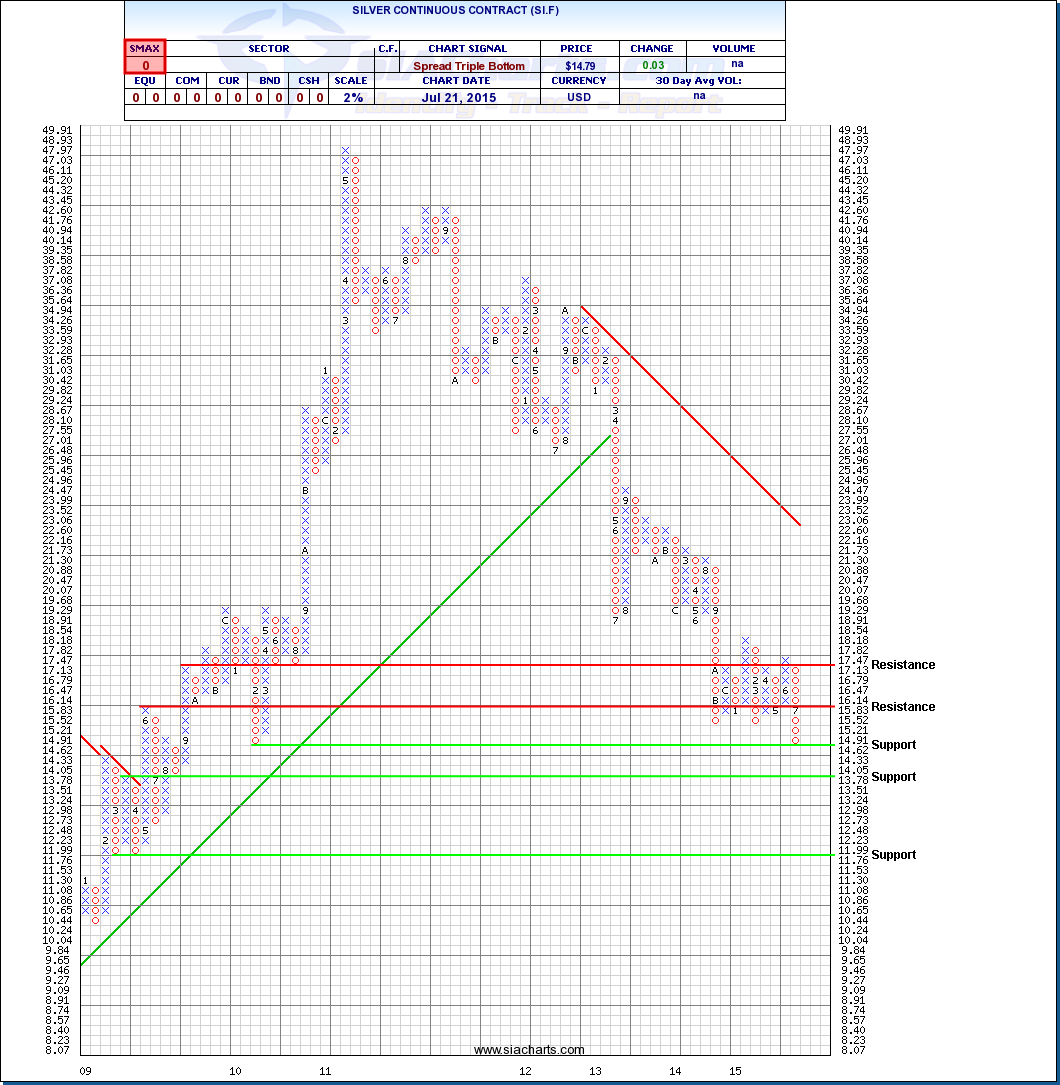
Looking at the chart of Silver, we can see that Silver has moved down to the Support level at $14.62 which was highlighted in the commentary from March. A break through this level, might not be as bearish as the gold chart above, but could see $13.78 as the next support level come into play. Beyond this we could see lower prices not seen since early 2009 come into play if this long-term weakness continues. Resistance above is found at $16.14 should this weakness reverse. With the SMAX showing a 0, Silver is still showing short-term weakness against all the asset classes.
Stocks in the SIA S&P/TSX 60 Report for example that are more reliant on silver prices like SLW.TO are down approximately -26% while in the Unfavored zone at the bottom of the report this past month as of July 21st close. Having the confidence through relative strength to stay away from these higher risk stocks and those types of drawdowns in your portfolio is one of the main reason SIA does this commentary every week to help advisors make these tough decisions through risk management.
For further discussion on this relationship and what it means for your portfolios, you can contact our customer support at 1-877-668-1332 or siateam@siacharts.com.
Click on Image to Enlarge
SIACharts.com specifically represents that it does not give investment advice or advocate the purchase or sale of any security or investment. None of the information contained in this website or document constitutes an offer to sell or the solicitation of an offer to buy any security or other investment or an offer to provide investment services of any kind. Neither SIACharts.com (FundCharts Inc.) nor its third party content providers shall be liable for any errors, inaccuracies or delays in content, or for any actions taken in reliance thereon.
Copyright © SIACharts.com