For this week's SIA Equity Leaders Weekly, we are going to focus on the USDCAD relationship again this year as many advisors want a current outlook and long-term outlook for the direction of this key relationship. We will also take another current outlook to analyze the change in trading range for Crude Oil while also keeping in mind that the long-term outlook for Crude Oil and Commodities hasn't changed.
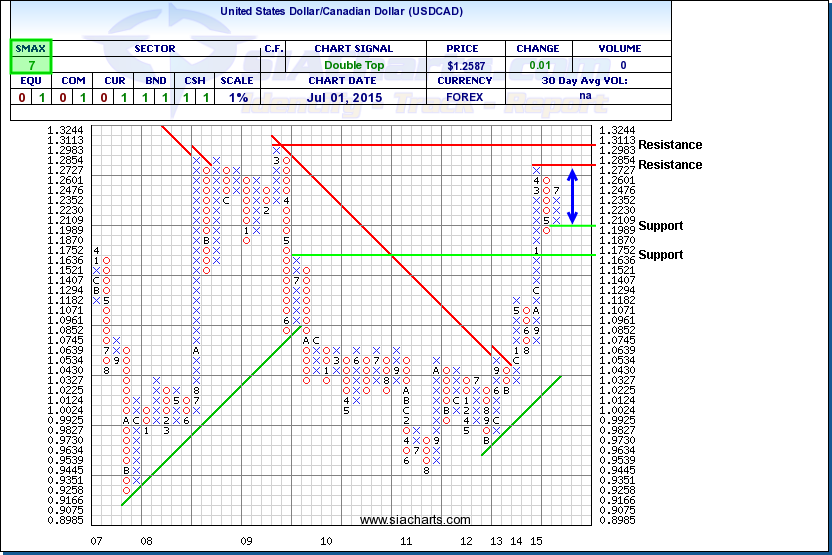
United States Dollar/Canadian Dollar (USDCAD)
Looking at the chart for the USDCAD, we can see that the April 9th commentary of a short-term pull-back came true after hitting significant resistance around the $1.30 level at $1.2854. This level continues to be the next resistance level to look out for and if it moves above this, significant resistance is found above at $1.3113 which represents the high from March of 2009. The most likely trading range is found between the first support level at $1.20 and the first resistance level at $1.28 for the near-term. The SMAX score (near-term strength comparison score) is still showing strength for the USD as it has moved up 4% since its last pull-back to recover much of these losses.
A breakthrough one of these key levels could help determine the long-term outlook for this relationship and which side of the currency you will want to be on that is affected by many macro factors including the continued weakness in Oil and other major commodities which has hurt the Canadian dollar more so in comparison.
Click on Image to Enlarge
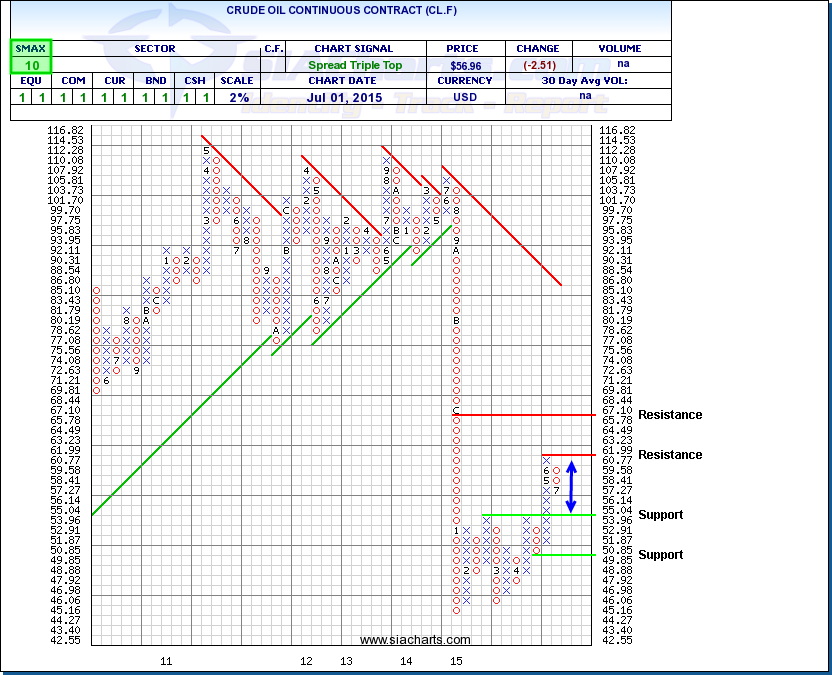
Crude Oil Continuous Contract (CL.F)
As we have focused much of our attention to Crude Oil in past Equity Leaders Weekly articles by staying away from this and other commodities on a long-term basis, not much has changed with this outlook. After trading most of the first 4 months of the year in the trading range between $45 and $55, CL.F has broke through to a new trading range between ~$54 to ~$62 currently. The first resistance level is now found at $61.99 from its prior move before it had a pull-back which could lead to the first support level at $53.96 coming into play.
CL.F is showing some near-term strength with an SMAX score of 10 out of 10 comparing to all asset classes, which could bring the second resistance level found at $67.10 into play if short-term strength increases. However, it is very possible that this important commodity continues to fluctuate between $50 to $60. The continued analysis of the supply/demand relationship through relative strength compared to other opportunities continues to be an important investment to monitor to help us understand if this trading range will continue to hold or if other macro events will cause a change in long-term outlook for Crude Oil.
Click on Image to Enlarge
SIACharts.com specifically represents that it does not give investment advice or advocate the purchase or sale of any security or investment. None of the information contained in this website or document constitutes an offer to sell or the solicitation of an offer to buy any security or other investment or an offer to provide investment services of any kind. Neither SIACharts.com (FundCharts Inc.) nor its third party content providers shall be liable for any errors, inaccuracies or delays in content, or for any actions taken in reliance thereon.
For a more in-depth analysis on the relative strength of the markets, commodities, currencies or for more information on SIACharts.com, you can contact our customer support at 1-877-668-1332 or siateam@siacharts.com.
Copyright © SIACharts.com