by Jesse Felder, The Felder Report
As most of you probably know, I decided back in late September last year that I wasn’t shaving until we saw another 10% correction. Although, the stock market typically sees about one per year, it’s been about three years now since we’ve seen a correction of that magnitude.
Jim Paulsen of Well Capital recently published a very interesting study on the strength and significance of this trend over the past three years. He finds that the unusual stability and persistence of the trend is a clear sign of euphoric sentiment:
Investor sentiment is currently at one of its highest levels since 1900! There have been only 14 periods since 1900 when the R-squared has risen above 90% and today it is near an all-time high record at slightly above 97%! …The stock market has typically struggled once the R-squared (investor sentiment) has risen above 90%. While the 13 previous cautionary signals since 1900 suggesting investor sentiment was too high have not been perfect, they have proved to be fairly good warning signs. For eight of the 13 signals, the stock market either immediately or fairly soon suffered a bear market (i.e., 1906, 1929, 1937, 1946, 1956, 1965, 1987, and 2007).
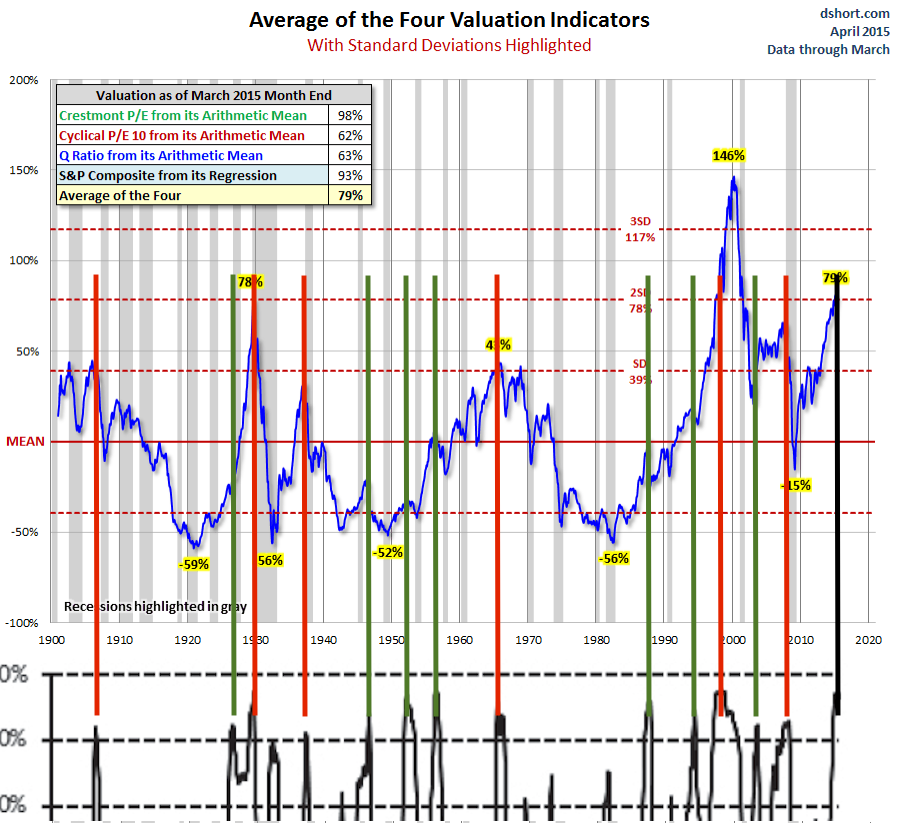
I decided it might be interesting to overlay Doug Short’s valuation model on top of Paulsen’s trend model (black lines at the bottom of the chart) in order to see what happened to those markets that were both overbullish and overvalued:
Of the 13 prior occurrences in Paulsen’s study when stocks became overbullish, 6 also marked times when the stock market was significantly overvalued, as represented by one standard deviation above average. These times are marked with red lines on the chart – 1906, 1929, 1937, 1965, 1998 and 2007. Every one of these occurrences was followed by an almost immediate bear market. (Though the internet bubble didn’t peak in 1998, the stock market did fall 22% that year from high to low, the widely accepted definition of a bear market.)
Today marks only the 7th time since 1900 that stocks have become both extremely overbullish and extremely overvalued based on these measures. If today’s occurrence is anything like those prior 6 we should be wary of the possibility of an impending bear market.
Copyright © The Felder Report


