"Activity Versus Inactivity"
by Jeffrey Saut, Chief Investment Strategist, Raymond James
April 20, 2015
Penalty kicks are a critical time of decision making for both the goal keeper and the penalty taker. Given that, for most professional games, the average number of goals scored is around 2.5, a penalty kick can have a major influence on the outcome of a match. Penalty kicks may reach speeds near 125 mph and are usually over within a quarter of a second. Thus, the goal keeper must make a decision on how to stop the shot before the ball is struck. Statistics show that goal keepers will most often jump to the left or right, hoping to guess correctly and place him (or her) self in a position to block the kick. Is this action by the keeper the best strategy? Research headed by Michael Bar-Eli at the Ben-Gurion University of the Negev in Israel makes some interesting conclusions about how goal keepers should defend penalty kicks.
Goal keeping behavior explains part of the goal scoring successes. In attempting to stop the penalty kick, goal keepers jump to the right or left 94% of the time. In doing this, they guess correctly only about 40% of the time (i.e. jump left, shot placed left). However, even when they guess correctly, they only stop 25-30% of the shots. The most intriguing part of the Dr. Bar-Eli’s analyses is that when goal keepers remain in the center of the goal and the shot is placed in the center, they make the save 60% of the time. Given that about 30% of penalty kicks are placed in the center third of the goal, remaining stationary in the center of the goal increases the keepers’ chances of stopping the shot from about 13% to more than 33%.
. . . The Science of Soccer Online
Human nature is a funny thing, as demonstrated by Ben-Gurion University’s study, because there is the human trait to be active. This is why soccer goalkeepers try to anticipate which way the penalty kicker is going to kick the ball and “dive” left or right to block it before the ball is actually kicked. In reality, the chances of blocking the kick increase by more than 100% if the goalkeeper remains “inactive” and stands in the middle of the goal! The same can be true for investors.
Plainly there are times for investors/traders to be active. But there are also times for them to be inactive, despite the trait of human nature to be “active;” and, for the past few months inactivity has been the best overall strategy. For example, last November the S&P 500 (SPX/2081.18) was changing hands around 2076. It now resides at 2081 for a change of some 5 points, or a gain of 0.00096%. More recently, since early February the SPX has been locked in a trading range between 2040 and 2120. While clearly there have been some stock “wins” over the past two months, most of the traders trying to trade the markets have not made much money, and in many cases lost money. The action has been consistent with our year-end “call” to raise some cash because our indicators/models suggested the first few months of 2015 were going to be rocky and more volatile. Now obviously last Friday’s Fade (-23 S&P points) had a lot to do with bringing the SPX back down from “tax day’s” ~2112 print-high, and an attempt to break above 2120 level, back into the position for a potential test of 2040 area. Also among the obvious were the various pundits’ reasons for the Spoo’s Swoon.
To be sure, the outage of Bloomberg terminals around the world overnight caused angst as the pros were “flying blind” without the benefit of quotes on investments/trades. When anything like that happens, the human trait to be active and sell takes over. China’s ill-timed change in margin requirements for OTC stocks certainly unnerved participants as margin financing was banned. Then there were renewed worries regarding Greece as rumors swirled that Greece would exit the EU in the next two weeks. Other excuses included: last Friday’s option expiration; earnings; negative Bund yields in Germany; the potentially blocked Time Warner deal; rising energy prices; the “never on a Friday crowd” (meaning in a free fall stocks rarely bottom on a Friday); and the list goes on. Whatever the reason, the SPX closed back below its 50-day moving average (DMA) of 2084.98, implying its 100-DMA at 2064.59 might have a magnetic attraction early this week. We remain focused on the aforementioned trading range of 2040 to 2120, preferring to remain “inactive” until one those levels is breached. That said, from our perspective, some very interesting chart events occurred last week.
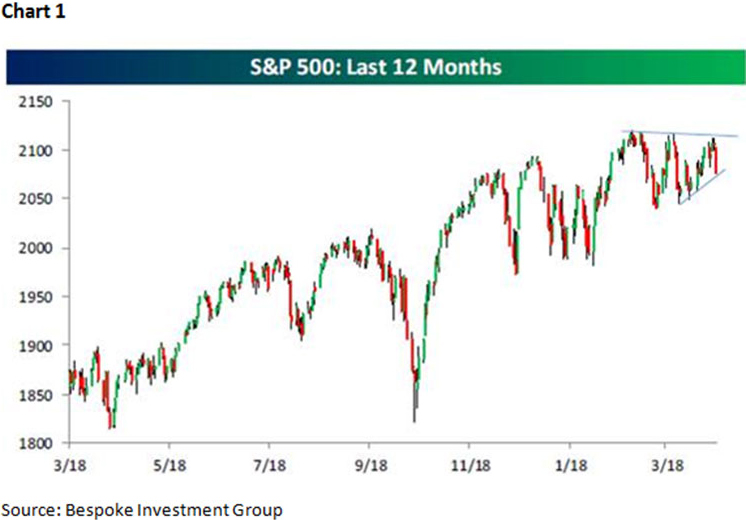
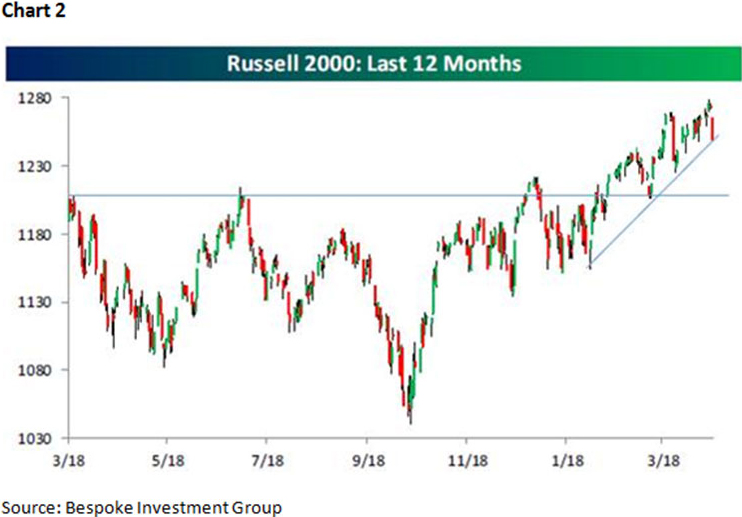
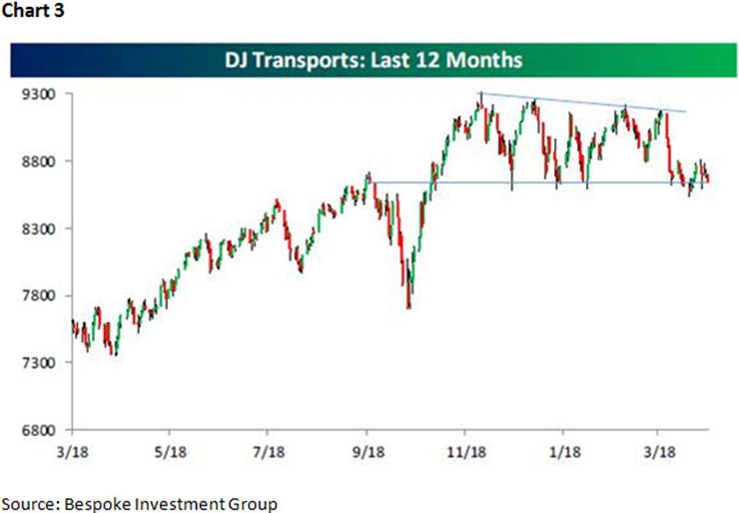
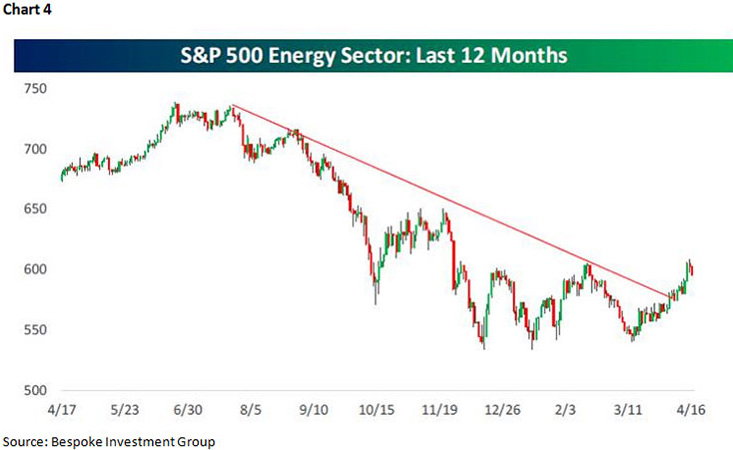
Indeed, the SPX, after failing to break out of the topside of the wedge formation, has now retreated to the bottom of that chart formation (Chart 1, see page 3). If it violates the bottom of the wedge’s uptrend line, it means there should be at least a downside test of the 2040 support level. While the Russell 2000 (RUT/1251.85) has not worked its way into a similar “wedge pattern,” it has declined to its rising trendline (Chart 2), which if not held would imply lower prices. Then there is the D-J Transportation Average (TRAN/8647.50), whose upside non-confirmation with the D-J Industrial’s (INDU/17826.30) new all-time high on March 2, 2015 at 18288.63 with a new all-time high of its own (Chart 3), has been a concern of ours for more than a month. Also worth noting is that the Trannies are again in jeopardy of breaking below a spread quadruple bottom. Speaking of quadruple bottoms, the S&P Energy Sector has held its respective quadruple bottom, and has broken out above its downtrend line (Chart 4), consistent with our “call” of months ago that crude oil has bottomed.
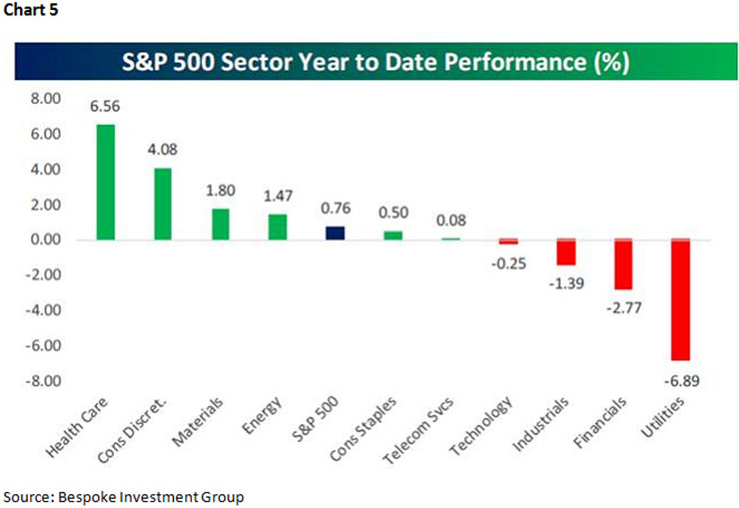
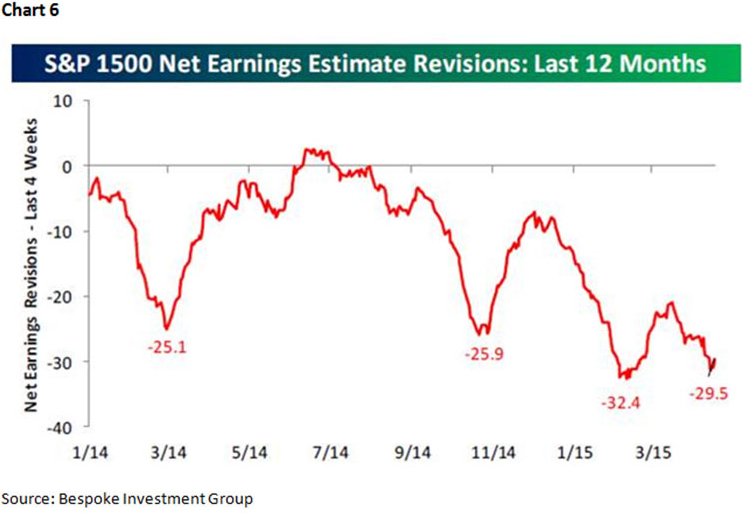
Speaking to the sector performance year-to-date, Healthcare, Consumer Discretionary, Materials, and Energy have outperformed the SPX, which “foots” with our preferred portfolio strategy (Chart 5). Given such performance finds the Energy sector overbought, and the Technology and Telecommunications sectors oversold, on a near-term basis. Meanwhile, as noted two weeks ago, earnings revisions have turned up after months of declines (Chart 6). Also worth consideration is that so far 63.7% of the companies reporting 1Q15 earnings have beaten their estimates (Chart 7). We continue to think, for many of the reasons mentioned in these reports, that come May the economic statistics will reaccelerate, leaving GDP growth at a more normalized 3% growth rate. Near-term, however, the equity markets do not believe this, still leaving them vulnerable to a downside “trap door.” If so, the “trap door” should be viewed within the construct of a secular bull market that has eight to nine years left on the upside.
The call for this week: My colleague Andrew Adams and I are in Las Vegas to deliver a keynote address at Raymond James Financial Services’ National Conference. If past is prelude, something impactful will happen in the equity markets in our absence. In fact, six years ago last month I stepped up on stage in Las Vegas in front of more than 2,000 financial advisors and said, as I held up a $100 bill:
“Who wants this $100 bill?” All the hands went up. I crumbled it up and said, “Who still wants this $100 bill?” All the hands went up. I then threw the bill onto the floor and ground it with my heel into the stage. I held the crumpled and soiled bill and said again, “Who now wants this $100 bill?” Again all the hands went up. Holding that same $100 bill in the air I spoke the words, “Just like y’all that have been crumbled, and soiled by the 2008 – 2009 Financial Fiasco, you too have NOT lost your value, just like this $100 bill has not lost it value!” With that, I threw the $100 bill into the audience and said, “Your worries are over. The stock market has bottomed!” I will reiterate that stance this year at our national conference, even though the near-term remains sketchy on a trading basis, which is why we continue to exercise the rarest commodity on Wall Street, patience!
Copyright © Raymond James