With Kinross Gold, Agnico Eagle Mines, Silver Wheaton, and Goldcorp all currently sitting within the Favoured Zone of the SIA S&P/TSX 60 Index Report, we have been fielding many calls from advisors all asking about Gold. While the Commodities Asset class and the Metals and Mining sector are still at the bottom of their respective reports, investors might be able to find shorter term gains within these still weak and volatile sectors. For this week's SIA Equity Leaders Weekly report, we will focus on a Canadian broad based gold miners ETF and then compare these individual gold companies on a relative basis against the precious metal itself.
iShares S&P/TSX Global Gold Index ETF (XGD.TO)
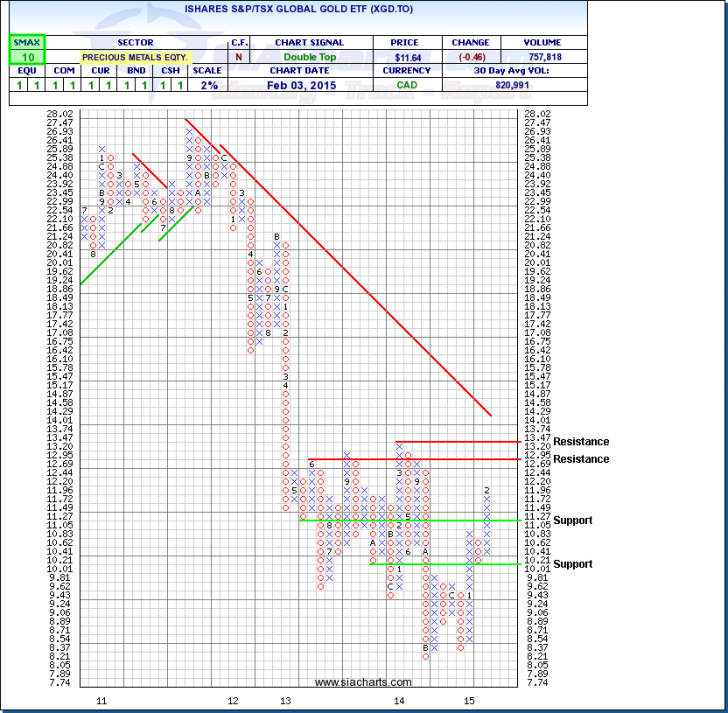
This well known Canadian ETF tracks the S&P/TSX Global Mining Index and is comprised of 38 Canadian traded companies with operations around the world. As you can see from the chart, XGD has been in and still remains in a long-term bearish decline since the fall of 2011. Over the past 2 years many investors have been fooled with a number of head-fakes and tricked with what looked like the appearance of a reversal.
Since the end of 2014, the ETF has had a tremendous run to the upside of over 31% YTD. With an SMAX of 10, the ETF is showing near-term strength against all asset classes. Overhead resistance will soon be found at $12.95 and then again at $13.47. To the downside, Support is first found at $11.05, and then lower at $10.01.
Many of the calls we've been receiving are in regards to whether this marks a structural turnaround in gold stocks or possibly just another head-fake. One thing that needs to be noted is that the XGD ETF is still a long ways away from reversing its bearish downtrend, and any long positions taken whether it is in an individual company or a broad ETF, one needs to realize how volatile this sector can and will continue to be. Another very important factor to consider is the relationship between these gold stocks and that of the underlying commodity.
Click on Image to Enlarge
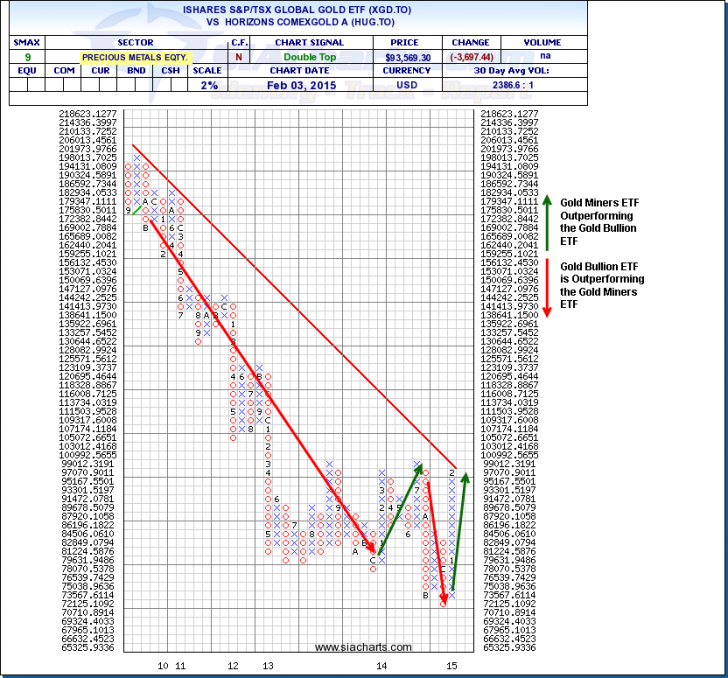
Gold Stocks vs. Gold Bullion (XGD.TO vs. HUG.TO)
Our second chart is a comparison of the Gold Miners ETF (XGD.TO) vs. the Gold Bullion ETF (HUG.TO). We can see in this chart that there have been significant changes in outperformance between the two Gold participants that can offer additional return if used. Gold Bullion has seen some historically strong periods of outperformance from 2010 - 2014, but currently this comparison chart is showing a VS SMAX score of 9 in favor of the Gold Miners ETF.
These ETFs can be very volatile, but as the comparison charts show, there are long periods of time where one has outperformed comparatively against the other. As noted above, since the beginning of this year the Gold Miners are up over 31%, where the Bullion is only up around 7%. At a time like now when such a discrepancy exists between the two, additional caution needs to taken if holding the individual names.
To learn more about how to utilize our system, how these commodity outlooks could affect your portfolio, or other commodity outlooks, please call or email us at 1-877-668-1332 or siateam@siacharts.com.
Click on Image to Enlarge
SIACharts.com specifically represents that it does not give investment advice or advocate the purchase or sale of any security or investment. None of the information contained in this website or document constitutes an offer to sell or the solicitation of an offer to buy any security or other investment or an offer to provide investment services of any kind. Neither SIACharts.com (FundCharts Inc.) nor its third party content providers shall be liable for any errors, inaccuracies or delays in content, or for any actions taken in reliance thereon.
Copyright © SIACharts.com