


This week for the SIA Equity Leaders Weekly, we are going to discuss the growing ETF industry - why clients are demanding ETFs, how advisors are utilizing them in clients' portfolios and how SIACharts can be an indispensable resource for those advisors looking to develop effective ETF strategies.
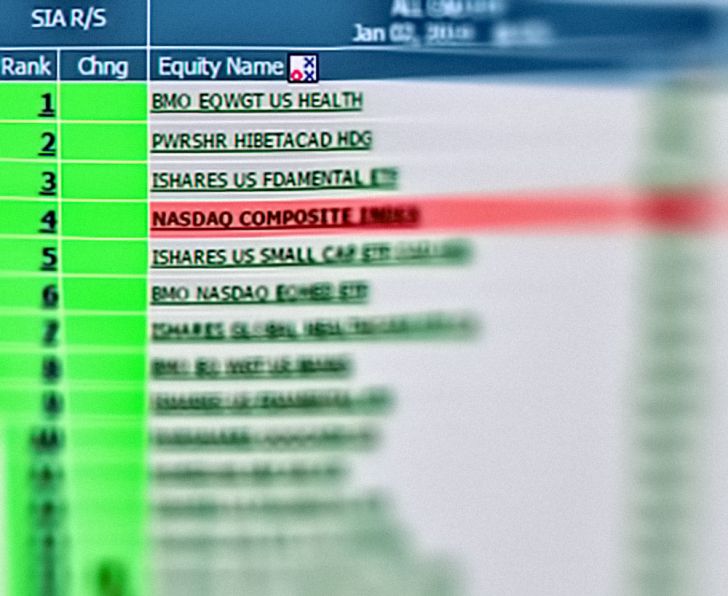
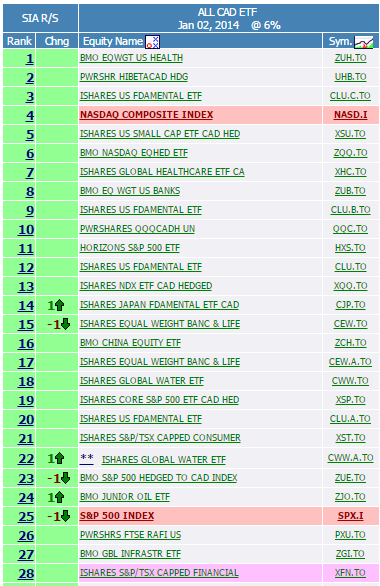
SIA ALL CAD ETF Report - Top 50
According to EY Global Asset Management's "Global ETF Survey" in January 2014, the ETF industry now tops US$2.3 trillion globally with over 5,000 ETFs/ETPs available. They expect annual growth rates of 15% - 30% globally over the next 5 years and believe the ETF industry will surpass the Hedge Fund industry in assets under management during the next 12-18 months. They believe this will be achieved through greater innovation and by taking market share from active and other passive competitors.
Investors are increasingly demanding greater use of ETFs within their portfolios citing lower costs, greater transparency, liquidity and overall convenience of buying and selling ETFs. A wealth of options are available to us now within the ETF space that allow for greater flexibility and efficiency with regards to building and managing portfolios. For these reasons advisors are beginning to utilize ETFs more and more to give them greater control in managing clients' assets. For example, advisors who employ a Tactical Asset Allocation Strategy find ETFs more effective for active management and to buy specific areas of the market they want to add. They are also using ETFs for more of their clients as an effective compromise between those who can't handle the daily volatility inherent in stocks and those who don't like the less flexible nature of buying and selling mutual funds, ie. short term trading penalties. ETFs combine the best aspects of both stock models and mutual fund models for many clients as they offer the trading flexibility of stocks with the diversification benefits of mutual funds. Another key strategy of how advisors are using ETFs is within their "core & explore" models. They are being used for both the "core" and "explore" component of a portfolio. Some advisors want a lower cost "core" component that enables them to use a tactical asset allocation strategy, while others want specific exposure to certain areas of the market to generate alpha and therefore will use it as an "explore" component.
So how does SIACharts help advisors wade through the thousands of ETFs available in the marketplace to develop a disciplined, repeatable and effective process for building and managing ETF Models? Our most popular ETF Report on our site for Canadians is the ALL CAD ETF Report. This report is currently made up of 270 ETFs diversified by asset classes, sectors and geographic regions - all Relative Strength ranked daily. This report is used by many of our advisors to pinpoint specific areas of strength and weakness within the ETFs listed and becomes a powerful yet very easy Report to use for building ETF Models. As an example of the effectiveness of overlaying our Relative Strength analysis on this Report, we have taken the Top 50 ETFs based on our relative strength ranking on Jan.2, 2014 and calculated their returns to Dec.31, 2014. This is simply to illustrate the 'concept' of how our relative strength process becomes a powerful tool to help advisors focus on only the strongest relative strength ETFs. It also eliminates the need for countless hours of research into which area of the market to buy or sell, and removes all subjective analysis, personal opinions and emotions from the investment process. The 2014 calendar year return for this hypothetical model was 13.84% with 75% Winning Months and Alpha Score of 2.32 vs S&P/TSX Composite Index. By focusing on ETFs within the Favoured Zone of this Report, advisors are able to align themselves with the strongest market trends while only spending a few minutes a day monitoring their portfolio.
Click on Image to Enlarge
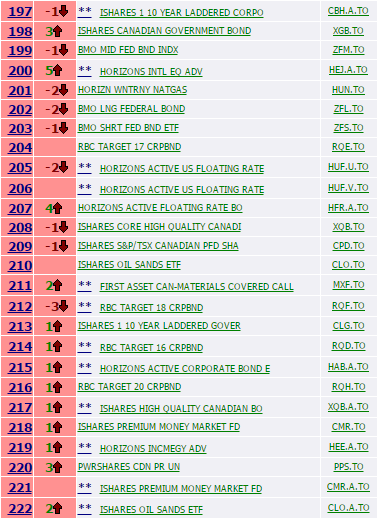
SIA ALL CAD ETF Report - Bottom 50
Conversely, we also took the Bottom 50 ETFs based on our relative strength ranking on Jan.2, 2014 and calculated their returns to Dec.31, 2014. The 2014 calendar year returns for this hypothetical model was 0.71% with 50% Winning Months and Alpha Score of -0.58 vs S&P/TSX Composite Index. This was roughly a 13% difference in return between the strongest and weakest ETFs within this Report in 2014. Again, the strategy of only adding investments within the Favoured Zones and avoiding those in the Unfavoured Zones, gives our advisors an objective perspective on the strength and weakness of every area of the market. This is not simply another momentum system, technical analysis system or trend-following system but rather a Relative Strength system that moves beyond the limitations of these other systems and enables us to track the relative money flows around the globe. Ultimately, markets move based upon money flows which impact the supply/demand relationship of everything. Supply/Demand is the only factor that has a direct correlation to price action. An objective understanding of price action is what SIACharts' Relative Strength Methodology was designed to analyze.
Of course, this example was a simple illustration of how to use our system but did not take into account trading that would occur throughout the year as ETFs would move throughout the Report. By removing ETFs that hit our sell signals and replacing them with ETFs that moved into our Buy zone would enable us to develop a more dynamic ETF Model that is more adaptive to the changing market conditions. We have taken the "guesswork" out of the investment process and built a unique system for quickly and effectively determining the 3 most important components of portfolio management - 1) Aligning with the major bull and bear market cycles 2) Developing your Tactical Asset Allocation strategy 3) Building and Monitoring your Portfolios. Combining a powerful platform (SIACharts) with an innovative investment vehicle (ETFs) is producing a new type of advisory practice in Canada - an ETF advisory practice that specializes in building and managing ETF Portfolios utilizing our Relative Strength process. As the ETF industry continues to grow and investors demand more use of ETFs within their portfolios, SIACharts has become one of Canada's premier ETF strategists for the advisor community! Is your practice ready for the impact that ETFs will make on the industry over the next 10 years?
To learn more about how to utilize our system to build and monitor simple but effective ETF Models and to transform your practice into an ETF Specialist, please call or email us at 1-877-668-1332 or siateam@siacharts.com.
Click on Image to Enlarge
SIACharts.com specifically represents that it does not give investment advice or advocate the purchase or sale of any security or investment. None of the information contained in this website or document constitutes an offer to sell or the solicitation of an offer to buy any security or other investment or an offer to provide investment services of any kind. Neither SIACharts.com (FundCharts Inc.) nor its third party content providers shall be liable for any errors, inaccuracies or delays in content, or for any actions taken in reliance thereon.
Copyright © SIACharts.com


