For this week's SIA Equity Leaders Weekly, we are going to discuss a simple but effective way of adding alpha to your portfolio by using ETFs found in our SIA ALL CAD ETF Report. Often, investors are looking for ways to add an "explore" component to a "core and explore" strategy, but don't want something too high risk or complicated. ETFs provide a simple approach for focusing on specific areas of strength within the market without having to contend with the volatility inherent in adding higher beta stocks to generate alpha. At the same time, investors want the flexibility of entering or exiting a position quickly if necessary which typically makes ETFs more efficient than mutual funds for this type of strategy.
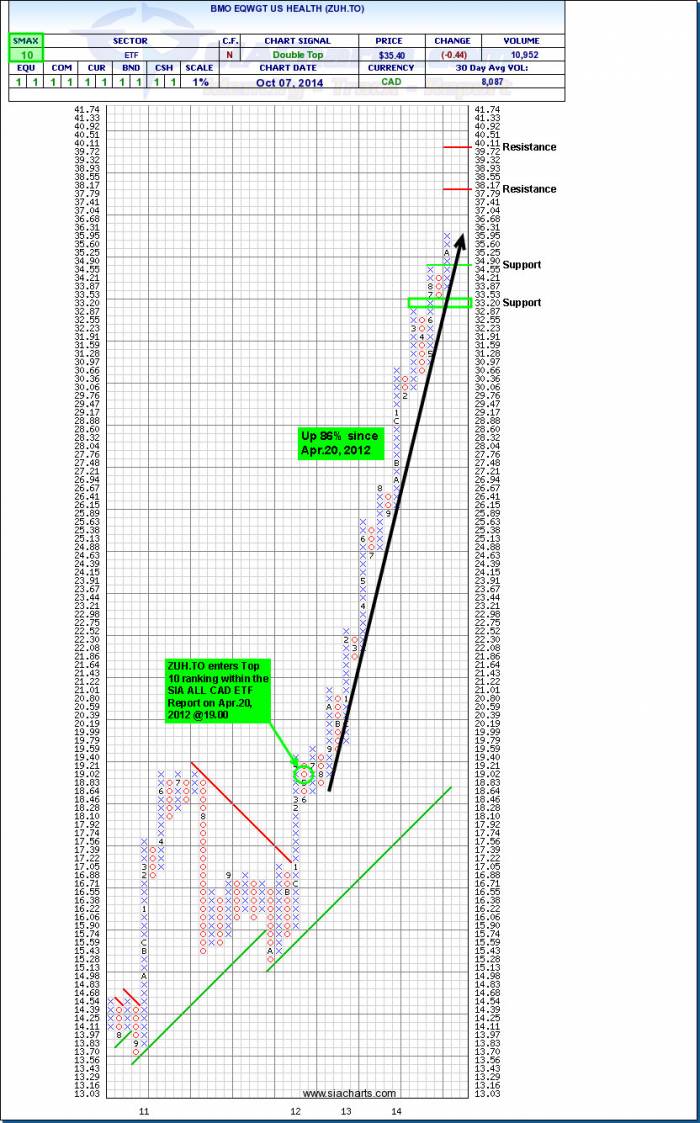
BMO Equal Weight US Health Care ETF (ZUH.TO)
The SIA ALL CAD ETF Report is a very popular report among our subscribers as it provides a detailed look at the relative strength of over 260 ETFs available to investors in Canada. This report is diversified with exposure to different asset classes, regions, and sectors and is a powerful tool to determine where you want to focus your investments. This Report can be used for both a "core" or "explore" component in a portfolio but for this article, we will focus on using it as part of the "explore" strategy. For this strategy you will want to focus only on ETFs within the Top 10 relative strength rankings with a positive SMAX Score (6 or higher) and hold it until it hits your sell signal. Depending on the timeframe of your strategy, you can adjust your sell signals to match your desired sensitivity to price movements, whether longer term or shorter term. The BMO Equal Weight U.S. Health Care ETF entered the Top 10 rankings on April 20, 2012 @$19.00. It remained in the Favoured Zone throughout this period. This was a sector that many investors were not thinking about 2 years ago and yet since April 20, 2012, it has moved up 86%. The SIA ALL CAD ETF Report helped investors to identify a long-term uptrend in Health Care and would have provided an effective "explore" holding to any portfolio.
Click on Image to Enlarge
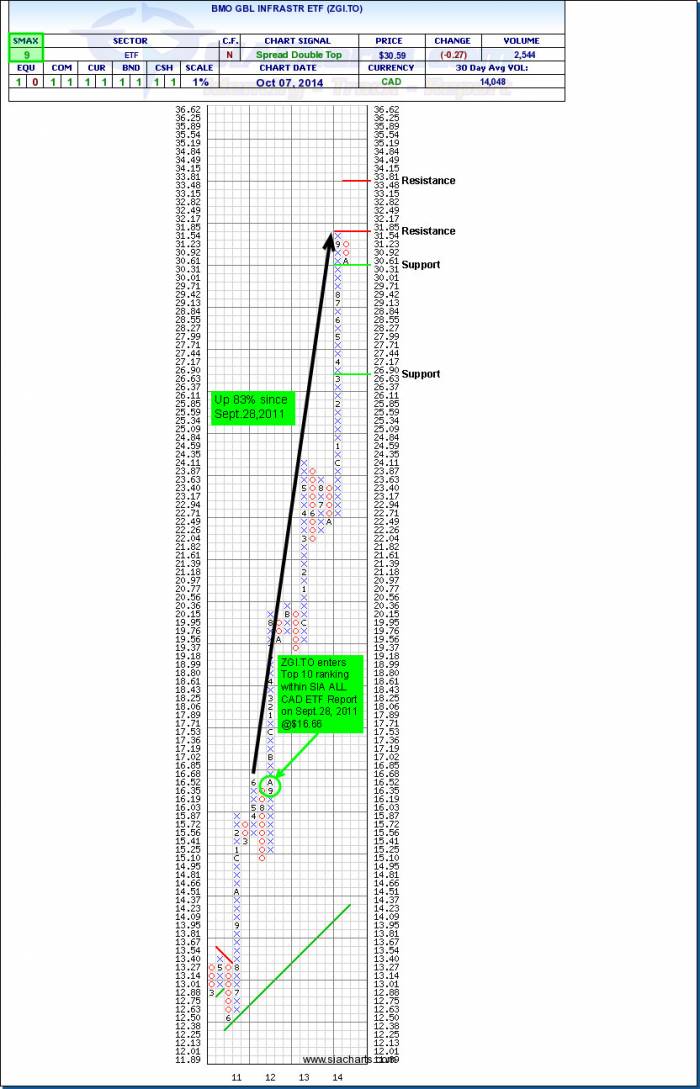
BMO Global Infrastructure ETF (ZGI.TO)
The BMO Global Infrastructure ETF (ZGI.TO) entered the Top 10 rankings on Sept.28, 2011 @$16.66. It remained in the Favoured Zone throughout this period and moved up 83% since that time. It was interesting to see that in mid-2013, this ETF went through a choppy period as the higher beta sectors were performing well and the overall markets had a very strong year. This ETF dropped in its rankings within this Report but remained in the Favoured Zone. And in 2014, ZGI.TO resumed its long-term uptrend. By giving yourself some room before hitting the sell button, you can try and reduce the whipsaws while letting your winners ride. Also, by choosing from ETFs within the Top 10 rankings, this gives an investor some options in terms of identifying ETFs that suit their overall risk profile. For example, if you see a Junior Oil or Junior Gas ETF within the Top 10 and would prefer a holding less volatile and less likely to move up and down the report dramatically, then choose another holding within the Top 10 with a positive SMAX Score that is more suitable for your portfolio.
Adding an "explore" component to your portfolio does not have to be time consuming or complicated, nor does it necessarily require heavy trading. By using the strongest relative strength ETFs from our SIA ALL CAD ETF Report, you can add an alpha strategy based upon our objective Relative Strength process and not based upon subjective analysis, predictions & forecasts, or personal opinions!
Click on Image to Enlarge
********
SIACharts.com specifically represents that it does not give investment advice or advocate the purchase or sale of any security or investment. None of the information contained in this website or document constitutes an offer to sell or the solicitation of an offer to buy any security or other investment or an offer to provide investment services of any kind. Neither SIACharts.com (FundCharts Inc.) nor its third party content providers shall be liable for any errors, inaccuracies or delays in content, or for any actions taken in reliance thereon.
Copyright © SIACharts.com
For more information on our ETF strategies, call or email us at 1-877-668-1332 or siateam@siacharts.com.